K+ promotes the favorable effect of polyamine on gene expression better than Na
- PMID: 32881909
- PMCID: PMC7470421
- DOI: 10.1371/journal.pone.0238447
K+ promotes the favorable effect of polyamine on gene expression better than Na
Abstract
Background: Polyamines are involved in a wide variety of biological processes including a marked effect on the structure and function of DNA. During our study on the interaction of polyamines with DNA, we found that K+ enhanced in vitro gene expression in the presence of polyamine more strongly than Na+. Thus, we sought to clarify the physico-chemical mechanism underlying this marked difference between the effects of K+ and Na+.
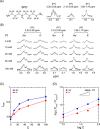
Principal findings: It was found that K+ enhanced gene expression in the presence of spermidine, SPD(3+), much more strongly than Na+, through in vitro experiments with a Luciferase assay on cell extracts. Single-DNA observation by fluorescence microscopy showed that Na+ prevents the folding transition of DNA into a compact state more strongly than K+. 1H NMR measurement revealed that Na+ inhibits the binding of SPD to DNA more strongly than K+. Thus, SPD binds to DNA more favorably in K+-rich medium than in Na+-rich medium, which leads to favorable conditions for RNA polymerase to access DNA by decreasing the negative charge.
Conclusion and significance: We found that Na+ and K+ exhibit markedly different effects through competitive binding with a cationic polyamine, SPD, to DNA, which causes a large difference in the higher-order structure of genomic DNA. It is concluded that the larger favorable effect of Na+ than K+ on in vitro gene expression observed in this study is well attributable to the significant difference between Na+ and K+ on the competitive binding inducing conformational transition of DNA.
Conflict of interest statement
The authors have declared that no competing interests exist.
Figures


Similar articles
-
Opposite effect of polyamines on In vitro gene expression: Enhancement at low concentrations but inhibition at high concentrations.PLoS One. 2018 Mar 1;13(3):e0193595. doi: 10.1371/journal.pone.0193595. eCollection 2018. PLoS One. 2018. PMID: 29494707 Free PMC article.
-
Na⁺,K⁺-ATPase activity in the posterior gills of the blue crab, Callinectes ornatus (Decapoda, Brachyura): modulation of ATP hydrolysis by the biogenic amines spermidine and spermine.J Membr Biol. 2011 Nov;244(1):9-20. doi: 10.1007/s00232-011-9391-5. Epub 2011 Oct 5. J Membr Biol. 2011. PMID: 21972069
-
Regulation by the exogenous polyamine spermidine of Na,K-ATPase activity from the gills of the euryhaline swimming crab Callinectes danae (Brachyura, Portunidae).Comp Biochem Physiol B Biochem Mol Biol. 2008 Apr;149(4):622-9. doi: 10.1016/j.cbpb.2007.12.010. Epub 2008 Jan 16. Comp Biochem Physiol B Biochem Mol Biol. 2008. PMID: 18272416
-
Polyamine inhibition of estrogen receptor (ER) DNA-binding and ligand-binding functions.Breast Cancer Res Treat. 1998 Apr;48(3):243-57. doi: 10.1023/a:1005949319064. Breast Cancer Res Treat. 1998. PMID: 9598871
-
The diversity of Na(+)-independent uptake systems for polyamines in rat intestinal brush-border membrane vesicles.Biochim Biophys Acta. 1993 Sep 19;1151(2):161-7. doi: 10.1016/0005-2736(93)90100-e. Biochim Biophys Acta. 1993. PMID: 8373792
Cited by
-
Characteristic effect of hydroxyurea on the higher-order structure of DNA and gene expression.Sci Rep. 2024 Jun 15;14(1):13826. doi: 10.1038/s41598-024-64538-y. Sci Rep. 2024. PMID: 38879539 Free PMC article.
-
Metabolic Heterogeneity, Plasticity, and Adaptation to "Glutamine Addiction" in Cancer Cells: The Role of Glutaminase and the GTωA [Glutamine Transaminase-ω-Amidase (Glutaminase II)] Pathway.Biology (Basel). 2023 Aug 14;12(8):1131. doi: 10.3390/biology12081131. Biology (Basel). 2023. PMID: 37627015 Free PMC article. Review.
-
Spatial-Temporal Genome Regulation in Stress-Response and Cell-Fate Change.Int J Mol Sci. 2023 Jan 31;24(3):2658. doi: 10.3390/ijms24032658. Int J Mol Sci. 2023. PMID: 36769000 Free PMC article. Review.
-
Activation/Inhibition of Gene Expression Caused by Alcohols: Relationship with the Viscoelastic Property of a DNA Molecule.Polymers (Basel). 2022 Dec 28;15(1):149. doi: 10.3390/polym15010149. Polymers (Basel). 2022. PMID: 36616499 Free PMC article.
-
Higher-order structure of DNA determines its positioning in cell-size droplets under crowded conditions.PLoS One. 2021 Dec 22;16(12):e0261736. doi: 10.1371/journal.pone.0261736. eCollection 2021. PLoS One. 2021. PMID: 34937071 Free PMC article.
References
-
- DOE. Handbook of methods for the analysis of the various parameters of the carbon dioxide system in sea water; version 2, A. G. Dickson & C. Goyet, eds., ORNL/CDIAC-74. 1994.
-
- Wright SH. Generation of resting membrane potential. Adv Physiol Educ. 2004;28(4):139–142. - PubMed
Publication types
MeSH terms
Substances
Grants and funding
LinkOut - more resources
Full Text Sources
Medical


