iBet uBet web content aggregator. Adding the entire web to your favor.


Link to original content: http://pubmed.ncbi.nlm.nih.gov/29416040/
BRE/BRCC45 regulates CDC25A stability by recruiting USP7 in response to DNA damage - PubMed Skip to main page content
U.S. flag

An official website of the United States government

Dot gov

The .gov means it’s official.
Federal government websites often end in .gov or .mil. Before sharing sensitive information, make sure you’re on a federal government site.

Https

The site is secure.
The https:// ensures that you are connecting to the official website and that any information you provide is encrypted and transmitted securely.

Access keys NCBI Homepage MyNCBI Homepage Main Content Main Navigation
. 2018 Feb 7;9(1):537.
doi: 10.1038/s41467-018-03020-6.

BRE/BRCC45 regulates CDC25A stability by recruiting USP7 in response to DNA damage

Affiliations

BRE/BRCC45 regulates CDC25A stability by recruiting USP7 in response to DNA damage

Kajal Biswas et al. Nat Commun. .

Abstract

BRCA2 is essential for maintaining genomic integrity. BRCA2-deficient primary cells are either not viable or exhibit severe proliferation defects. Yet, BRCA2 deficiency contributes to tumorigenesis. It is believed that mutations in genes such as TRP53 allow BRCA2 heterozygous cells to overcome growth arrest when they undergo loss of heterozygosity. Here, we report the use of an insertional mutagenesis screen to identify a role for BRE (Brain and Reproductive organ Expressed, also known as BRCC45), known to be a part of the BRCA1-DNA damage sensing complex, in the survival of BRCA2-deficient mouse ES cells. Cell viability by BRE overexpression is mediated by deregulation of CDC25A phosphatase, a key cell cycle regulator and an oncogene. We show that BRE facilitates deubiquitylation of CDC25A by recruiting ubiquitin-specific-processing protease 7 (USP7) in the presence of DNA damage. Additionally, we uncovered the role of CDC25A in BRCA-mediated tumorigenesis, which can have implications in cancer treatment.


Conflict of interest statement

The authors declare no competing financial interests.

Figures
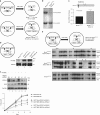
Fig. 1
Fig. 1
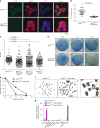
Identification of BRE as a genetic interactor of BRCA2 using a MSCV-based insertional mutagenesis screen. a Schematic representation of MSCV-mediated insertional mutagenesis in Brca2 conditional mouse ES cells. Brca2KO/KO cells generated after PGK-CRE-mediated deletion of the conditional allele are not viable. Mutagenesis by MSCV-CRE can generate viable Brca2KO/KO ES cells. b Southern blot analysis of HAT-resistant ES cell colony that lost conditional Brca2 allele (Brca2KO/KO; Clone 3d) after MSCV-CRE transduction. Upper band: conditional allele (CKO); lower band: knock-out allele (KO). c Quantification of Bre expression by real-time RT-PCR in Brca2 conditional mutant (Brca2CKO/KO) and Brca2KO/KO ES cells with viral insertion at chr: 5qB1 (Brca2KO/KO;Clone 3d). Data are represented as mean ± s.d. Top panel shows the distance between viral insertion and start of first exon of Bre. d Expression of HA-tagged BRE from MSCV LTR in Brca2CKO/KO clones. Two independent clones Clone #1 and Clone #2 analyzed by western blot analysis were used further. Left panel shows the scheme of relevant alleles of Brca2CKO/KO; MSCV-BRE ES cells. e Southern blot analysis of HAT-resistant ES cell colonies after CRE-mediated deletion of conditional allele in Brca2CKO/KO; MSCV-BRE ES cells to identify Brca2KO/KO clones (marked with solid stars), upper band: conditional allele (CKO); lower band: knock-out allele (KO). Schematic diagram of CRE-induced loss of conditional Brca2 allele in Brca2CKO/KO; MSCV-BRE cells is shown at the top. f Upper panel shows western blot for BRCA2 knockdown by two different shRNAs (#1 and #2) and a non-specific (NS) control and HA-BRE expression in MCF7 cells that were stably expressing either empty vector (MCF7Neo) or vector expressing HA-BRE (MCF7BRE). GAPDH was used as a loading control. Growth of MCF7 cells after BRCA2 knockdown in the presence or absence of HA-BRE expression represented in the lower panel. Fold growth was calculated by dividing cell counts on particular day with cell count on day 1. P values are shown in Supplementary Table 2. P values were calculated using paired two-tailed t-test
Fig. 2
Fig. 2
BRE overexpression rescues Brca2KO/KO cell viability without affecting BRCA2 function. a Ionizing radiation (IR)-induced RAD51 foci formation in Brca2CKO/KO and Brca2KO/KO; MSCV-BRE ES cells. RAD51 foci are in turquoise, γ-H2AX foci in magenta, and nuclei are stained with 4,6-diamidino-2-phenylindole (DAPI, blue). Merged images show co-localization of RAD51 and γ-H2AX foci (yellow foci). b Quantification of RAD51 foci shown in a. Twenty-five nuclei were counted for each genotype. Error bars represent the mean ± s.d. c Scatter plot showing DNA fiber analysis of the indicated cell lines. P values were calculated using Mann–Whitney test. d Methylene blue-stained plates showing the sensitivity of Brca2CKO/KO and Brca2KO/KO; MSCV-BRE ES cells to different doses of IR. e Quantification of the colonies shown in d. Colony numbers obtained in plates with no treatment (0 Gy) are considered as 100%. Average of three experiments is shown. Error bars represent s.d. values. f Representative metaphase spread showing chromosomal aberration (marked with arrows) in Brca2CKO/KO and Brca2KO/KO; MSCV-BRE ES cells. g Quantification of different aberrations as well as total aberrations in 50 randomly selected Brca2CKO/KO and Brca2KO/KO; MSCV-BRE metaphase spreads
Fig. 3
Fig. 3
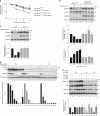
BRE overexpression affects IR-induced CDC25A degradation. a DNA synthesis in ES cells after different doses of IR. b Western blot analysis of CDC25A and Tyr15 phosphorylation of CDK1 (p-CDK1) at different times after exposing the cells to 6 Gy IR in Brca2CKO/KO;MSCV-BRE cells compared to Brca2CKO/KO cells. GAPDH was used as a loading control. Numbers below indicate the lane numbers. The quantification of CDC25A (middle panel) and p-CDK1 (lower panel) band intensity for each cell line is shown as histogram. Relative band intensities were calculated by dividing GAPDH-normalized CDC25A/p-CDK1 intensity at particular time point with GAPDH-normalized CDC25A/p-CDK1 intensity of corresponding untreated cells. c MCF7 cells with inducible HA-BRE expression cassette were transfected with CRE plasmid and subjected to 6 Gy IR after 48 h of transfection. Western blots of endogenous CDC25A in presence (lanes 4–6) and absence (lanes 1–3) of HA-BRE expression at different times after irradiation is shown in the upper panel. Lower panel shows the quantification of CDC25A band intensity normalized against GAPDH. d Immunoblot showing CDC25A degradation after IR treatment in MCF7 cells transfected either with non-specific (NS) siRNA or two different siRNAs against BRE (#1 and #2). Histone H3 was used as a loading control. Relative CDC25A band intensities were calculated by dividing GAPDH-normalized CDC25A intensity at a particular time point with GAPDH-normalized CDC25A intensity of untreated (0 h IR) cells of corresponding siRNA treatment. e Western blot showing IR-induced CDC25A degradation in MCF7 cells with stably integrated CRE inducible HA-BRE expression cassette after transfection either with non-specific (NS) siRNA or two different siRNAs against MERIT40 (#1 and #2) along with CRE-expressing plasmid. Non-specific (NS) siRNA transfection was used as control. Relative abundance of CDC25A at a particular time point was measured by comparing GAPDH-normalized band intensities at that point divided by GAPDH-normalized CDC25A intensity of untreated (0 h IR) cells of corresponding treatment. All histograms show the average of three independent experiments and error bars represent s.d. P values were calculated using paired two-tailed t-test and tabulated in Supplementary Table 2
Fig. 4
Fig. 4
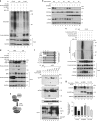
DNA damage-induced BRE-USP7 interaction stabilizes CDC25A. a Ubiquitylation of FLAG-CDC25A in cells harvested 4 h after 6 Gy IR in absence (lanes 1–4) or presence (lanes 5, 6) of exogenous BRE. CDC25A was immuno-precipitated using anti-FLAG antibody (lanes 1, 2, 5, 6), IgG was used as control (lanes 3, 4). b MCF7 cells stably expressing CRE-inducible HA-BRE were transfected with either non-specific (NS, lanes 1–2 and 7–8) or two independent USP7-specific (USP7 #1, lanes 3, 4, 9, 10 and USP7 #2, lanes 5, 6, 11, 12) siRNAs along with or without plasmids expressing CRE and irradiated with 6 Gy IR. Western blot shows the abundance of endogenous CDC25A in non-IR cells and 4 h after irradiation. HDM2 was used as a control for USP7 knockdown. c FLAG-CDC25A ubiquitylation in cells harvested 4 h after 6 Gy IR in absence (lanes 1–3) or in presence of exogenous USP7 (lanes 4, 5) or catalytic inactive USP7 (USP7-CS; lanes 6, 7). Anti-FLAG antibody (lanes 2–7) was used to pull down CDC25A, IgG was used as control (lane 1). HDM2 was used as a control for USP7 activity. d Co-immunoprecipitation of FLAG-CDC25A, BRE, and endogenous USP7 from MCF7 cells using anti-BRE antibody (lanes 1–4) and IgG antibody (lanes 5–6); 5 μM MG132 was added after irradiation to increase CDC25A level and harvested after 2 h. e Model depicting the interaction of BRE, CDC25A, and USP7. In presence of DNA breaks, BRE interacts with USP7 and then BRE, USP7, and CDC25A complex is formed. For simplicity, MERIT40 is not included in the model. f Co-immunoprecipitation of USP7 and different deletion mutants of BRE tagged with HA-epitope from irradiated HEK293 cells using USP7 antibody. Top panel shows the schematic representation of different deletion mutants of BRE. Numbers in the top panel mark different USP7 binding motifs. Stars indicate different HA-BRE proteins. g Western blots showing IR-induced degradation of CDC25A after expressing HA-BRE or HA-BRE mutant defective in USP7 binding (FLΔ123). GAPDH was used as a loading control for all blots. Histogram represents mean ± s.d. values of relative band intensities. P values are calculated using the paired two-tailed t-test and presented in Supplementary Table 2
Fig. 5
Fig. 5
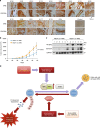
CDC25A overexpression can rescue ES cell lethality of Brca2KO/KO. a Immunoblot showing IR-induced degradation of CDC25A in PL2F7 mES cells expressing either HA-BRE or HA-BRE mutant defective in USP7 binding (FLΔ123). GAPDH was used as control. The histogram below shows the average relative abundance of CDC25A at particular time points from three independent experiments. All intensities were normalized against corresponding GAPDH band intensities. Supplementary Table 2 shows the P values. b Representative Southern blot analysis showing the identification of Brca2KO/KO cells (marked with solid stars) after CRE-mediated deletion of conditional allele in indicated cell lines. Upper band: conditional allele (CKO); lower band: knock-out allele (KO). c Western blot showing CDC25A abundance in Brca2CKO/KO and Brca2CKO/KO; MSCV-Cdc25A ES cells before (lanes 1, 3, 5) and 2 h after 6 Gy IR (lanes 2, 4, 6). Top panel represents the scheme of expression of FLAG-CDC25A from MSCV LTR. GAPDH was used as a loading control. d Southern blot analysis of HAT-resistant ES cell colonies after CRE-mediated deletion of conditional allele in Brca2CKO/KO; MSCV-Cdc25A ES cells to identify Brca2KO/KO clones (marked with solid stars), upper band: conditional allele (CKO); lower band: knock-out allele (KO). e CDC25A mRNA expression in two different breast cancer data sets from The Cancer Genome Atlas (TCGA). Left panel represents the data set of METABRIC breast cancer with 2433 tumors and right panel shows the breast invasive carcinoma data set of 825 tumors. Dots or squares in graphs represent individual tumors. Middle line, median; whiskers, minimal and maximum values. Significance was calculated using unpaired t-test with Welch’s corrections
Fig. 6
Fig. 6
Physiological relevance of BRE overexpression. a Immunohistological staining of 15 BRCA2-deficient tumors using BRE and CDC25A antibodies. Numbers represent different tumor numbers. Control represents staining with control IgG. H: high expression, L: low expression. b Allograft tumor growth of KB2P1.21 (Brca2 negative) cells with and without stable expression of HA-BRE. Values are represented as mean ± s.e.m. P values were calculated using ANCOVA test. c Western blot showing the expression of HA-BRE and CDC25A in tumors from allograft experiment. GAPDH was used as control. d Proposed model explaining the survival of BRE overexpressed BRCA2-deficient cells. CDC25A protein stabilization is regulated by the balanced action of ubiquitylation and deubiquitylation mediated by β-TRCP and DUB3, respectively. In cells with normal BRE expression level, loss of BRCA2 induces DNA damage that leads to β-TRCP-mediated degradation of CDC25A and cells undergo cell cycle arrest and apoptosis. BRCA2 loss in BRE overexpressing cells results an increase in BRE/USP7/CDC25A complex that perturbs the balance of CDC25A ubiquitylation/deubiquitylation and leads to an increase in CDC25A even in presence of DNA damage. This elevated level of CDC25A leads to the survival of cells with damaged DNA

Similar articles

Cited by

References

    1. Breast Cancer Linkage C.. Cancer risks in BRCA2 mutation carriers. J. Natl. Cancer Inst. 1999;91:1310–1316. doi: 10.1093/jnci/91.15.1310. - DOI - PubMed
    1. Wooster R, et al. Identification of the breast cancer susceptibility gene BRCA2. Nature. 1995;378:789–792. doi: 10.1038/378789a0. - DOI - PubMed
    1. Wang Y, et al. Rare variants of large effect in BRCA2 and CHEK2 affect risk of lung cancer. Nat. Genet. 2014;46:736–741. doi: 10.1038/ng.3002. - DOI - PMC - PubMed
    1. Murphy KM, et al. Evaluation of candidate genes MAP2K4, MADH4, ACVR1B, and BRCA2 in familial pancreatic cancer: deleterious BRCA2 mutations in 17% Cancer Res. 2002;62:3789–3793. - PubMed
    1. van Asperen CJ, et al. Cancer risks in BRCA2 families: estimates for sites other than breast and ovary. J. Med. Genet. 2005;42:711–719. doi: 10.1136/jmg.2004.028829. - DOI - PMC - PubMed

Publication types

MeSH terms