Understanding the mechanical response of double-stranded DNA and RNA under constant stretching forces using all-atom molecular dynamics
- PMID: 28634300
- PMCID: PMC5502642
- DOI: 10.1073/pnas.1705642114
Understanding the mechanical response of double-stranded DNA and RNA under constant stretching forces using all-atom molecular dynamics
Abstract
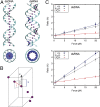
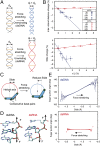
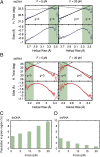
Multiple biological processes involve the stretching of nucleic acids (NAs). Stretching forces induce local changes in the molecule structure, inhibiting or promoting the binding of proteins, which ultimately affects their functionality. Understanding how a force induces changes in the structure of NAs at the atomic level is a challenge. Here, we use all-atom, microsecond-long molecular dynamics to simulate the structure of dsDNA and dsRNA subjected to stretching forces up to 20 pN. We determine all of the elastic constants of dsDNA and dsRNA and provide an explanation for three striking differences in the mechanical response of these two molecules: the threefold softer stretching constant obtained for dsRNA, the opposite twist-stretch coupling, and its nontrivial force dependence. The lower dsRNA stretching resistance is linked to its more open structure, whereas the opposite twist-stretch coupling of both molecules is due to the very different evolution of molecules' interstrand distance with the stretching force. A reduction of this distance leads to overwinding in dsDNA. In contrast, dsRNA is not able to reduce its interstrand distance and can only elongate by unwinding. Interstrand distance is directly correlated with the slide base-pair parameter and its different behavior in dsDNA and dsRNA traced down to changes in the sugar pucker angle of these NAs.
Keywords: DNA; RNA; molecular dynamics; nucleic acid mechanical properties; twist-stretch coupling.
Conflict of interest statement
The authors declare no conflict of interest.
Figures


Similar articles
-
Understanding the Relative Flexibility of RNA and DNA Duplexes: Stretching and Twist-Stretch Coupling.Biophys J. 2017 Mar 28;112(6):1094-1104. doi: 10.1016/j.bpj.2017.02.022. Biophys J. 2017. PMID: 28355538 Free PMC article.
-
Explaining the striking difference in twist-stretch coupling between DNA and RNA: A comparative molecular dynamics analysis.Nucleic Acids Res. 2015 Dec 2;43(21):10143-56. doi: 10.1093/nar/gkv1028. Epub 2015 Oct 12. Nucleic Acids Res. 2015. PMID: 26464435 Free PMC article.
-
Remarkable similarity of force induced dsRNA conformational changes to stretched dsDNA and their detection using electrical measurements.Phys Chem Chem Phys. 2018 Nov 21;20(45):28920-28928. doi: 10.1039/c8cp03574a. Phys Chem Chem Phys. 2018. PMID: 30422138
-
Probing the mechanical properties, conformational changes, and interactions of nucleic acids with magnetic tweezers.J Struct Biol. 2017 Jan;197(1):26-36. doi: 10.1016/j.jsb.2016.06.022. Epub 2016 Jun 29. J Struct Biol. 2017. PMID: 27368129 Review.
-
Recognition of double-stranded RNA by proteins and small molecules.Biopolymers. 2003 Sep;70(1):86-102. doi: 10.1002/bip.10413. Biopolymers. 2003. PMID: 12925995 Review.
Cited by
-
Engineering tunable catch bonds with DNA.Nat Commun. 2024 Oct 12;15(1):8828. doi: 10.1038/s41467-024-52749-w. Nat Commun. 2024. PMID: 39396048 Free PMC article.
-
Effect of temperature on anisotropic bending elasticity of dsRNA: an all-atom molecular dynamics simulation.RSC Adv. 2024 May 28;14(24):17170-17177. doi: 10.1039/d4ra02354d. eCollection 2024 May 22. RSC Adv. 2024. PMID: 38808231 Free PMC article.
-
Systematic Comparison of Atomistic Force Fields for the Mechanical Properties of Double-Stranded DNA.J Chem Theory Comput. 2024 Mar 12;20(5):2261-2272. doi: 10.1021/acs.jctc.3c01089. Epub 2024 Feb 27. J Chem Theory Comput. 2024. PMID: 38411091 Free PMC article.
-
Temperature-dependent elasticity of DNA, RNA, and hybrid double helices.Biophys J. 2024 Mar 5;123(5):572-583. doi: 10.1016/j.bpj.2024.01.032. Epub 2024 Feb 2. Biophys J. 2024. PMID: 38340722
-
The origin of different bending stiffness between double-stranded RNA and DNA revealed by magnetic tweezers and simulations.Nucleic Acids Res. 2024 Mar 21;52(5):2519-2529. doi: 10.1093/nar/gkae063. Nucleic Acids Res. 2024. PMID: 38321947 Free PMC article.
References
-
- Bustamante C, Bryant Z, Smith SB. Ten years of tension: Single-molecule DNA mechanics. Nature. 2003;421:423–427. - PubMed
-
- Gore J, et al. DNA overwinds when stretched. Nature. 2006;442:836–839. - PubMed
-
- Lionnet T, Joubaud S, Lavery R, Bensimon D, Croquette V. Wringing out DNA. Phys Rev Lett. 2006;96:178102. - PubMed
-
- Kosikov KM, Gorin AA, Zhurkin VB, Olson WK. DNA stretching and compression: Large-scale simulations of double helical structures. J Mol Biol. 1999;289:1301–1326. - PubMed
Publication types
MeSH terms
Substances
LinkOut - more resources
Full Text Sources
Other Literature Sources


