iBet uBet web content aggregator. Adding the entire web to your favor.


Link to original content: http://pubmed.ncbi.nlm.nih.gov/28383497/
Evo-SETI: A Mathematical Tool for Cladistics, Evolution, and SETI - PubMed Skip to main page content
U.S. flag

An official website of the United States government

Dot gov

The .gov means it’s official.
Federal government websites often end in .gov or .mil. Before sharing sensitive information, make sure you’re on a federal government site.

Https

The site is secure.
The https:// ensures that you are connecting to the official website and that any information you provide is encrypted and transmitted securely.

Access keys NCBI Homepage MyNCBI Homepage Main Content Main Navigation
. 2017 Apr 6;7(2):18.
doi: 10.3390/life7020018.

Evo-SETI: A Mathematical Tool for Cladistics, Evolution, and SETI

Affiliations

Evo-SETI: A Mathematical Tool for Cladistics, Evolution, and SETI

Claudio Maccone. Life (Basel). .

Abstract

The discovery of new exoplanets makes us wonder where each new exoplanet stands along its way to develop life as we know it on Earth. Our Evo-SETI Theory is a mathematical way to face this problem. We describe cladistics and evolution by virtue of a few statistical equations based on lognormal probability density functions (pdf) in the time. We call b-lognormal a lognormal pdf starting at instant b (birth). Then, the lifetime of any living being becomes a suitable b-lognormal in the time. Next, our "Peak-Locus Theorem" translates cladistics: each species created by evolution is a b-lognormal whose peak lies on the exponentially growing number of living species. This exponential is the mean value of a stochastic process called "Geometric Brownian Motion" (GBM). Past mass extinctions were all-lows of this GBM. In addition, the Shannon Entropy (with a reversed sign) of each b-lognormal is the measure of how evolved that species is, and we call it EvoEntropy. The "molecular clock" is re-interpreted as the EvoEntropy straight line in the time whenever the mean value is exactly the GBM exponential. We were also able to extend the Peak-Locus Theorem to any mean value other than the exponential. For example, we derive in this paper for the first time the EvoEntropy corresponding to the Markov-Korotayev (2007) "cubic" evolution: a curve of logarithmic increase.

Keywords: Darwinian evolution; SETI; cladistics; entropy; molecular clock.


Conflict of interest statement

The author declares no conflict of interest.

Figures

Figure 1
Figure 1
Increasing DARWINIAN EVOLUTION as the increasing number of living species on Earth between 3.5 billion years ago and now. The red solid curve is the mean value of the GBM stochastic process LGBM(t) given by Equation (22) (with t replaced by (t-ts)), while the blue dot-dot curves above and below the mean value are the two standard deviation upper and lower curves, given by Equations (11) and (12), respectively, with mGBM(t) given by Equation (22). The “Cambrian Explosion” of life, that on Earth started around 542 million years ago, is evident in the above plot just before the value of ′0.5 billion years in time, where all three curves “start leaving the time axis and climbing up”. Notice also that the starting value of living species 3.5 billion years ago is one by definition, but it “looks like” zero in this plot since the vertical scale (which is the true scale here, not a log scale) does not show it. Notice finally that nowadays (i.e., at time t=0 ) the two standard deviation curves have exactly the same distance from the middle mean value curve, i.e., 30 million living species more or less the mean value of 50 million species. These are assumed values that we used just to exemplify the GBM mathematics: biologists might assume other numeric values.
Figure 2
Figure 2
The Darwinian Exponential is used as the geometric locus of the peaks of b-lognormals for the GBM case. Each b-lognormal is a lognormal starting at a time b (birth time) and represents a different species that originated at time b of the Darwinian Evolution. This is cladistics, as seen from the perspective of the Evo-SETI model. It is evident that, when the generic “running b-lognormal” moves to the right, its peak becomes higher and narrower, since the area under the b-lognormal always equals one. Then, the (Shannon) entropy of the running b-lognormal is the degree of evolution reached by the corresponding species (or living being, or a civilization, or an ET civilization) in the course of Evolution (see, for instance, [14,15,16,17,18,19]).
Figure 3
Figure 3
EvoEntropy (in bits per individual) of the latest species appeared on Earth during the last 3.5 billion years if the mean value is an increasing exponential, i.e., if our lognormal stochastic process is a GBM. This straight line shows that a Man (nowadays) is 25.575 bits more evolved than the first form of life (RNA) 3.5 billion years ago.
Figure 4
Figure 4
According to Markov and Korotayev, during the Phanerozoic, the biodiversity shows a steady, but not monotonic, increase from near zero to several thousands of genera.
Figure 5
Figure 5
The Cubic mean value curve (thick red solid curve) ± the two standard deviation curves (thin solid blue and green curve, respectively) provide more mathematical information than Figure 4. One is now able to view the two standard deviation curves of the lognormal stochastic process, Equations (11) and (12), that are completely missing in the Markov-Korotayev theory and in their plot shown in Figure 4. This author claims that his Cubic mathematical theory of the Lognormal stochastic process L(t) is a more profound mathematization than the Markov-Korotayev theory of Evolution, since it is stochastic, rather than simply deterministic.
Figure 6
Figure 6
The EvoEntropy Equation (44) of the Markov-Korotayev Cubic mean value Equation (31) of our lognormal stochastic process L(t) applies to the growing number of Genera during the Phanerozoic. Starting with the left part of the curve, one immediately notices that, in a few million years around the Cambrian Explosion of 542 million years ago, the EvoEntropy had an almost vertical growth, from the initial value of zero, to the value of approximately 10 bits per individual. These were the few million years when the bilateral symmetry became the dominant trait of all primitive creatures inhabiting the Earth during the Cambrian Explosion. Following this, for the next 300 million years, the EvoEntropy did not significantly change. This represents a period when bilaterally-symmetric living creatures, e.g., reptiles, birds, and very early mammals, etc., underwent little or no change in their body structure (roughly up to 310 million years ago). Subsequently, after the “mother” of all mass extinctions at the end of the Paleozoic (about 250 million years ago), the EvoEntropy started growing again in mammals. Today, according to the Markov-Korotayev model, the EvoEntropy is about 12.074 bits/individual for humans, i.e., much less than the 25.575 bits/individual predicted by the GBM exponential growth shown in Figure 3. Therefore, the question is: which model is correct?
Figure 7
Figure 7
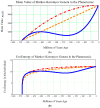
Comparing the mean value mL(t) (A) and the EvoEntropy(t) (B) in the event of growth with the CUBIC mean value of Equation (31) (blue solid curve), with the LINEAR Equation (29) (dash-dash orange curve), or with the PARABOLIC Equation (30) (dash-dot red curve). It can be seen that, for all these three curves, starting with the left part of the curve, in a few million years around the Cambrian Explosion of 542 million years ago, the EvoEntropy had an almost vertical growth from the initial value of zero to the value of approximately 10 bits per individual. Again, as is seen in Figure 6, these were the few million years where the bilateral symmetry became the dominant trait of all primitive creatures inhabiting the Earth during the Cambrian Explosion.

Similar articles

References

    1. Markov A.V., Korotayev A.V. Phanerozoic Marine Biodiversity Follows a Hyperbolic Trend. Palaeoworld. 2007;16:311–318. doi: 10.1016/j.palwor.2007.01.002. - DOI
    1. Markov A.V., Korotayev A.V. The Dynamics of Phanerozoic Marine Biodiversity Follows a Hyperbolic Trend. Zhurnal Obschei Biologii. 2007;68:3–18. - PubMed
    1. Markov A.V., Korotayev A.V. Hyperbolic growth of marine and continental biodiversity through the Phanerozoic and community evolution. Zhurnal Obshchei Biologii. 2008;69:175–194. - PubMed
    1. Markov A.V., Anisimov V.A., Korotayev A.V. Relationship between genome size and organismal complexity in the lineage leading from prokaryotes to mammals. Paleontol. J. 2010;44:363–373. doi: 10.1134/S0031030110040015. - DOI
    1. Grinin L., Markov A., Korotayev A. On similarities between biological and social evolutionary mechanisms: Mathematical modeling. Cliodynamics. 2013;4:185–228.

LinkOut - more resources