iBet uBet web content aggregator. Adding the entire web to your favor.


Link to original content: http://pubmed.ncbi.nlm.nih.gov/27235787/
Human ex-vivo action potential model for pro-arrhythmia risk assessment - PubMed Skip to main page content
U.S. flag

An official website of the United States government

Dot gov

The .gov means it’s official.
Federal government websites often end in .gov or .mil. Before sharing sensitive information, make sure you’re on a federal government site.

Https

The site is secure.
The https:// ensures that you are connecting to the official website and that any information you provide is encrypted and transmitted securely.

Access keys NCBI Homepage MyNCBI Homepage Main Content Main Navigation
. 2016 Sep-Oct:81:183-95.
doi: 10.1016/j.vascn.2016.05.016. Epub 2016 May 25.

Human ex-vivo action potential model for pro-arrhythmia risk assessment

Affiliations

Human ex-vivo action potential model for pro-arrhythmia risk assessment

Guy Page et al. J Pharmacol Toxicol Methods. 2016 Sep-Oct.

Abstract

While current S7B/E14 guidelines have succeeded in protecting patients from QT-prolonging drugs, the absence of a predictive paradigm identifying pro-arrhythmic risks has limited the development of valuable drug programs. We investigated if a human ex-vivo action potential (AP)-based model could provide a more predictive approach for assessing pro-arrhythmic risk in man. Human ventricular trabeculae from ethically consented organ donors were used to evaluate the effects of dofetilide, d,l-sotalol, quinidine, paracetamol and verapamil on AP duration (APD) and recognized pro-arrhythmia predictors (short-term variability of APD at 90% repolarization (STV(APD90)), triangulation (ADP90-APD30) and incidence of early afterdepolarizations at 1 and 2Hz to quantitatively identify the pro-arrhythmic risk. Each drug was blinded and tested separately with 3 concentrations in triplicate trabeculae from 5 hearts, with one vehicle time control per heart. Electrophysiological stability of the model was not affected by sequential applications of vehicle (0.1% dimethyl sulfoxide). Paracetamol and verapamil did not significantly alter anyone of the AP parameters and were classified as devoid of pro-arrhythmic risk. Dofetilide, d,l-sotalol and quinidine exhibited an increase in the manifestation of pro-arrhythmia markers. The model provided quantitative and actionable activity flags and the relatively low total variability in tissue response allowed for the identification of pro-arrhythmic signals. Power analysis indicated that a total of 6 trabeculae derived from 2 hearts are sufficient to identify drug-induced pro-arrhythmia. Thus, the human ex-vivo AP-based model provides an integrative translational assay assisting in shaping clinical development plans that could be used in conjunction with the new CiPA-proposed approach.

Keywords: Action potential; Drug discovery and development; Human heart; Pro-arrhythmia assessment; Ventricular trabeculae.


Figures

Fig. 1
Fig. 1
Experimental protocol. The protocol consisted of measuring APs from individual human ventricular trabeculae over a period of 2 hrs using sharp-electrode recordings of the membrane potential. Baseline AP stability was assessed by continuous recording for 31 min in control vehicle (Tyrode's, 0.1% DMSO) at pacing rates of 1 Hz (25 min), 2 Hz (3 min) and 1 Hz (3 min). Subsequently, 3 cumulative concentrations of the test article were applied while repeating the same 31-minute pacing protocol for each subsequent drug concentration. For each heart, 3 tissue samples were tested with vehicle control followed by test article and one tissue was used as a vehicle time control. Each one of the 5 drugs was assessed in 5 hearts.
Fig. 2
Fig. 2
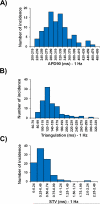
Distribution histograms of APD90, triangulation and STV in human ventricular trabeculae at a pacing rate of 1 Hz.
Fig. 3
Fig. 3
Stability of AP recordings over time in human ventricular trabeculae. (A) Typical APs recorded from a human ventricular trabecula at a pacing rate of 1 Hz in the presence of vehicle control and after exposure to 0.1 μM dofetilide, the positive control. V1, V2 and V3 correspond to the 1st, 2nd and 3rd application of vehicle (n=21). (B) Mean % changes in APD30, APD50 and APD90 induced by 3 sequential additions of vehicle and after exposure to dofetilide at 1 and 2 Hz. (C) Mean changes in APD90, triangulation, STV and EAD incidence when trabeculae were incubated with vehicle and dofetilide at 1 and 2 Hz. Note that the effects of vehicle and dofetilide on APD90 / triangulation / EAD activity and STV are plotted on a separate y-axis. (D) Effects of 3 sequential additions of vehicle on STV and triangulation as a function of change in APD90 in human ventricular trabeculae at pacing rates of 1 and 2 Hz. Note that the effects of vehicle on STV and triangulation are plotted on a separate y-axis. 1(in red)/1 (in blue), 2 (in red/2 (in blue) and 3 (in red)/3 (in blue) correspond to V1, V2 and V3 of vehicle, respectively. ٭,*,*P<0.05 versus values from vehicle.
Fig. 4
Fig. 4
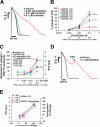
Effects of dofetilide on AP in human ventricular trabeculae. (A) Typical APs recorded from a human ventricular trabecula at a pacing rate of 1 Hz in the presence of vehicle control and after exposure to dofetilide at 0.001, 0.01 and 0.1 μM. (B) Mean % changes in APD30, APD50 and APD90 induced by addition of dofetilide at 1 and 2 Hz (n=15). (C) Mean changes in APD90, triangulation, STV and EAD incidence when trabeculae were incubated with dofetilide at 1 and 2 Hz. Note that the effects of dofetilide on APD90 / triangulation / EAD activity and STV are plotted on a separate y-axis. (D) Shows a representative EAD recorded from the same trabecula as in (A) in the presence of 0.1 μM dofetilide and stimulated at 1 Hz. (E) Effects of dofetilide addition on STV and triangulation as a function of change in APD90 in human ventricular trabeculae at pacing rates of 1 and 2 Hz. Note that the effects of dofetilide on STV and triangulation are plotted on a separate y-axis. 1(in red)/1 (in blue), 2 (in red/2 (in blue) and 3 (in red)/3 (in blue) correspond to 0.001, 0.01 and 0.1 μM of dofetilide, respectively. #Decrease in excitabity was observed after exposure to 0.01 and 0.1 μM dofetilide at 1 and 2 Hz. ETPC, Effective therapeutic plasma concentration. ٭,*,*P<0.05 versus values from vehicle.
Fig. 5
Fig. 5
Effects of d,l-sotalol on AP in human ventricular trabeculae. (A) Typical APs recorded from a human ventricular trabecula at a pacing rate of 1 Hz in the presence of vehicle control and after exposure to d,l-sotalol at 1, 10 and 100 μM. (B) Mean % changes in APD30, APD50 and APD90 induced by addition of d,l-sotalol at 1 and 2 Hz (n=15). (C) Mean changes in APD90, triangulation, STV and EAD incidence when trabeculae were incubated with d,l-sotalol at 1 and 2 Hz. Note that the effects of d,l-sotalol on APD90 / triangulation / EAD activity and STV are plotted on a separate y-axis. (D) Effects of d,l-sotalol addition on STV and triangulation as a function of change in APD90 in human ventricular trabeculae at pacing rates of 1 and 2 Hz. Note that the effects of d,l-sotalol on STV and triangulation are plotted on a separate y-axis. 1(in red)/1 (in blue), 2 (in red/2 (in blue) and 3 (in red)/3 (in blue) correspond to 1, 10 and 100 μM of d,l-sotalol, respectively. # Decrease in excitability was observed after exposure to 10 and 100 μM d,l-sotalol at 2 Hz. ETPC, Effective therapeutic plasma concentration. ٭,*,*P<0.05 versus values from vehicle.
Fig. 6
Fig. 6
Effects of quinidine on AP in human ventricular trabeculae. (A) Typical APs recorded from a human ventricular trabecula at a pacing rate of 1 Hz in the presence of vehicle control and after exposure to quinidine at 0.1, 1 and 10 μM. (B) Mean % changes in APD30, APD50 and APD90 induced by addition of quinidine at 1 and 2 Hz (n=15). (C) Mean changes in APD90, triangulation, STV and EAD incidence when trabeculae were incubated with quinidine at 1 and 2 Hz. Note that the effects of quinidine on APD90 / triangulation / EAD activity and STV are plotted on a separate y-axis. (D) Effects of quinidine addition on STV and triangulation as a function of change in APD90 in human ventricular trabeculae at pacing rates of 1 and 2 Hz. Note that the effects of quinidine on STV and triangulation are plotted on a separate y-axis. 1(in red)/1 (in blue), 2 (in red/2 (in blue) and 3 (in red)/3 (in blue) correspond to 0.1, 1 and 10 μM of quinidine, respectively. ETPC, Effective therapeutic plasma concentration. ٭,*P<0.05 versus values from vehicle.
Fig. 7
Fig. 7
Effects of paracetamol on AP in human ventricular trabeculae. (A) Typical APs recorded from a human ventricular trabecula at a pacing rate of 1 Hz in the presence of vehicle control, and after exposure to paracetamol (2, 20 and 200 μM) and 0.1 μM dofetilide (the positive control). (B) Mean % changes in APD30, APD50 and APD90 induced by addition of paracetamol and after exposure to dofetilide at 1 and 2 Hz (n=15). (C) Mean changes in APD90, triangulation, STV and EAD incidence when trabeculae were incubated with paracetamol and dofetilide at 1 and 2 Hz. Note that the effects of paracetamol and dofetilide on APD90 / triangulation / EAD activity and STV are plotted on a separate y-axis. (D) Effects of paracetamol addition on STV and triangulation as a function of change in APD90 in human ventricular trabeculae at pacing rates of 1 and 2 Hz. Note that the effects of paracetamol on STV and triangulation are plotted on a separate y-axis. 1(in red)/1 (in blue), 2 (in red/2 (in blue) and 3 (in red)/3 (in blue) correspond to 2, 20 and 200 μM of paracetamol, respectively. ETPC, Effective therapeutic plasma concentration. ٭,*,*P<0.05 versus values from vehicle.
Fig. 8
Fig. 8
Effects of verapamil on AP in human ventricular trabeculae. (A) Typical APs recorded from a human ventricular trabecula at a pacing rate of 1 Hz in the presence of vehicle control, and after exposure to verapamil (0.01, 0.1 and 1 μM) and 0.1 μM dofetilide (the positive control). (B) Mean % changes in APD30, APD50 and APD90 induced by addition of verapamil at 1 and 2 Hz (n=15). (C) Mean changes in APD90, triangulation, STV and EAD incidence when trabeculae were incubated with verapamil at 1 and 2 Hz. Note that the effects of verapamil on APD90 / triangulation / EAD activity and STV are plotted on a separate y-axis. (D) Effects of verapamil addition on STV and triangulation as a function of change in APD90 in human ventricular trabeculae at pacing rates of 1 and 2 Hz. Note that the effects of verapamil on STV and triangulation are plotted on a separate y-axis. 1(in red)/1 (in blue), 2 (in red/2 (in blue) and 3 (in red)/3 (in blue) correspond to 0.01, 0.1 and 1 μM of verapamil, respectively. ETPC, Effective therapeutic plasma concentration. ٭,*,*P<0.05 versus values from vehicle.
Fig. 9
Fig. 9
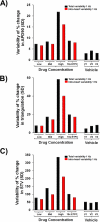
Variability in measurements performed from different donor hearts and from different trabeculae from the same heart. (A), (B) and (C) show the “Total” and “intra-heart” variabilities for APD90, triangulation and STV at a pacing rate of 1 Hz, respectively (n=96). V1, V2 and V3 correspond to the 1st, 2nd and 3rd application of vehicle. Conc., concentration; SD, Standard deviation; 10x ETPC, 10-fold Effective Therapeutic Plasma Concentration.
Fig. 10
Fig. 10
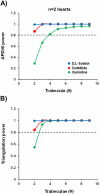
Estimation of sample size with 2 hearts. (A) and (B) show the estimation of sample size for APD90 and triangulation at a pacing rate of 1 Hz for the concentration of around 10-fold the ETPC of dofetilide (0.01 μM), d,l-sotalol (100 μM) or quinidine (10 μM). Power calculation was performed on a % change scale. Each tissue sample served as its own control. Treatment effect unequal to zero was detected with Linear Mixed Effect Model. Target power 80% (dashed black line) corresponds to an 80% chance of concluding there was a real effect.

Similar articles

Cited by

References

    1. Akar FG, Rosenbaum DS. Transmural Electrophysiological Heterogeneities Underlying Arrhythmogenesis in Heart Failure. Circulation Research. 2003;93:638–645. - PubMed
    1. Anon . ICH S7B Note for guidance on the nonclinical evaluation of the potential for delayed ventricular repolarization (QT interval prolongation) by human pharmaceuticals. London: May 25, 2005a. Reference CHMP/ICH/423/02. - PubMed
    1. Anon . ICH E14 Note for guidance on the clinical evaluation of QT/QTc interval prolongation and proarrhythmic potential for nonantiarrhythmic drugs. London: May 25, 2005b. Reference CHMP/ICH/2/04.
    1. Boukens BJ, Sulkin MS, Gloschat CR, Ng FS, Vigmond EJ, Efimov IR. Transmural APD gradient synchronizes repolarization in the human left ventricular wall. Cardiovascular Research. 2015;108(1):188–96. - PMC - PubMed
    1. Brandenburger M, Wenzel J, Bogdan R, Richardt D, Nguemo F, Reppel M, et al. Organotypic slice culture from human adult ventricular myocardium. Cardiovascular Research. 2012;93:50–59. - PubMed

MeSH terms

Substances