iBet uBet web content aggregator. Adding the entire web to your favor.


Link to original content: http://pubmed.ncbi.nlm.nih.gov/25313077/
Double-stranded RNA under force and torque: similarities to and striking differences from double-stranded DNA - PubMed Skip to main page content
U.S. flag

An official website of the United States government

Dot gov

The .gov means it’s official.
Federal government websites often end in .gov or .mil. Before sharing sensitive information, make sure you’re on a federal government site.

Https

The site is secure.
The https:// ensures that you are connecting to the official website and that any information you provide is encrypted and transmitted securely.

Access keys NCBI Homepage MyNCBI Homepage Main Content Main Navigation
. 2014 Oct 28;111(43):15408-13.
doi: 10.1073/pnas.1407197111. Epub 2014 Oct 13.

Double-stranded RNA under force and torque: similarities to and striking differences from double-stranded DNA

Affiliations

Double-stranded RNA under force and torque: similarities to and striking differences from double-stranded DNA

Jan Lipfert et al. Proc Natl Acad Sci U S A. .

Abstract

RNA plays myriad roles in the transmission and regulation of genetic information that are fundamentally constrained by its mechanical properties, including the elasticity and conformational transitions of the double-stranded (dsRNA) form. Although double-stranded DNA (dsDNA) mechanics have been dissected with exquisite precision, much less is known about dsRNA. Here we present a comprehensive characterization of dsRNA under external forces and torques using magnetic tweezers. We find that dsRNA has a force-torque phase diagram similar to that of dsDNA, including plectoneme formation, melting of the double helix induced by torque, a highly overwound state termed "P-RNA," and a highly underwound, left-handed state denoted "L-RNA." Beyond these similarities, our experiments reveal two unexpected behaviors of dsRNA: Unlike dsDNA, dsRNA shortens upon overwinding, and its characteristic transition rate at the plectonemic buckling transition is two orders of magnitude slower than for dsDNA. Our results challenge current models of nucleic acid mechanics, provide a baseline for modeling RNAs in biological contexts, and pave the way for new classes of magnetic tweezers experiments to dissect the role of twist and torque for RNA-protein interactions at the single-molecule level.

Keywords: RNA; force; magnetic tweezers; nucleic acids; torque.


Conflict of interest statement

The authors declare no conflict of interest.

Figures
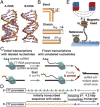
Fig. 1.
Fig. 1.
Construction of a torsionally constrained double-stranded RNA for magnetic tweezers measurements. (A) Comparison of A-form dsRNA [Protein Data Bank (PDB) ID code 1RNA (57)] and B-form dsDNA [PDB ID code 2BNA (58)]. (B) Cartoon of the elastic deformations of dsRNA: bending, stretching, and twisting. (C) Schematic of the protocol to generate double-stranded RNA molecules with multiple attachment points at both ends. Initial transcription reactions incorporate multiple biotinylated adenosine (green circles) or digoxigenated uracil (yellow squares) bases and stall at a fourth nucleotide. After purification, transcription reactions are restarted and complete the 4.2-kbp transcripts. In the final step, the purified RNA strands are annealed to yield dsRNA with chemical modifications at each end. (D) Schematic of the two DNA templates used to generate dsRNA with multiple labels at both ends. (E) Cartoon of a magnetic tweezers experiment on dsRNA (not to scale). A streptavidin-coated magnetic bead is tethered to an anti-digoxigenin–coated surface by a dsRNA molecule with multiple attachment points at both ends. A surface-attached reference bead is tracked simultaneously for drift correction. Permanent magnets above the flow cell are used to exert a stretching force F and to control the rotation of the magnetic bead via its preferred axis m0. N, north pole; S, south pole.
Fig. 2.
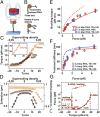
Fig. 2.
Response of dsRNA to changes in linking number at various stretching forces. (A) Rotation–extension curves for dsRNA at different stretching forces (0.25, 0.5, 1, 2, 4, and 5.5 pN, from dark to light). The top axis shows the supercoiling density, σ = ΔLk/Lk0 (SI Appendix, Materials and Methods). Dashed lines denote the buckling points at positive turns, and solid lines denote linear fits to the extension in the plectonemic region. (B) Critical supercoiling density for buckling as a function of applied force for dsRNA and dsDNA. A simple mechanical model for supercoiling (8) predicts the right trend (dashed line), whereas a refined model (9) provides a good fit to the dsRNA data with the torsional stiffness of the plectonemic state (P) set to 23 ± 3 nm (solid line). (C) Slope of the rotation–extension curves in the plectonemic regime at σ > 0 for dsRNA and dsDNA. The 16-kbp dsDNA data are from ref . The simple mechanical mode again predicts the right trend (dashed line), whereas the refined model provides an approximate fit to the dsRNA data with P = 20 ± 3 nm (solid line). Data points in B and C are means and SEM of at least five independent measurements. (D) Rotation–extension curves for dsRNA out to large negative σ at F = 0.5, 2, 3, 6, and 7.5 pN (dark to light). Solid lines indicate unwinding; dashed lines indicate subsequent rewinding. All data presented were obtained in the presence of 100 mM NaCl.
Fig. 3.
Fig. 3.
Torque response of dsRNA at various stretching forces. (A) Schematic of a magnetic torque tweezers (MTTs) measurement on dsRNA. The MTTs are a variant of MTs that enables the measurement of torque. (B) Principle of torque measurements in MTTs. After overwinding (or underwinding) the dsRNA tether by N turns, the dsRNA exerts a restoring torque on the bead that leads to a shift in the equilibrium angular position from θ0 to θN. This shift can be directly converted to torque (SI Appendix, Fig. S4). (C) Rotation–torque curves for 4.2-kbp dsRNA at F = 0.5, 1, 3, and 6.5 pN (dark to light). Gray lines correspond to fits to the torque plateaus to determine buckling and melting torques. Colored lines are linear fits to determine the torsional stiffness. (Inset) Additional data for F = 3 pN. (D) Rotation–extension curves corresponding to the measurements in C. Solid lines indicate linear fits in the plectonemic regime. (E) Buckling torques as a function of applied stretching force for dsRNA and dsDNA, determined from the plateaus in the rotation–torque data at positive turns. The data points at 6.5 pN (triangles) correspond to the critical torques for P-RNA and P-DNA formation. The prediction of a simple mechanical model for supercoiling (8) captures the right trend (dashed line), whereas a refined model (9) provides a good fit to the dsRNA data with the torsional stiffness of the plectonemic state set to P = 21.6 ± 2 nm (solid line). (F) Effective twist persistence length C for dsRNA and dsDNA as a function of F determined from linear fits of the torque vs. applied turns data in the elastic twist regime. The lines are fits of the Moroz–Nelson model (37), with the high force data (F > 2.5 pN; solid lines) yielding limiting values of CRNA = 100 ± 2 nm and CDNA = 109 ± 4 nm. Data points for dsRNA in E and F are means and SEM of at least five independent measurements; data for 7.9-kbp DNA are from ref. . (G) Phase diagram for dsRNA as a function of applied force and torque. Red points connected by solid lines correspond to transitions directly measured in this work. Dashed lines correspond to putative transition regions that have not been directly observed. A, A-form dsRNA; −scA and +scA, negatively and positively supercoiled A-form dsRNA, respectively. L-RNA, P-RNA, and S-RNA denote the alternative dsRNA conformations discussed in the main text.
Fig. 4.
Fig. 4.
Double-stranded RNA has a positive twist–stretch coupling. (A) Time traces of the extension of a dsRNA tether held at F = 7 pN and underwound by −6 or overwound by 12 turns. Raw traces (120 Hz) are in red and filtered data (10 Hz) are in gray. The data demonstrate that dsRNA shortens when overwound. (B) Changes in tether extension upon over- and underwinding at F = 7 pN of a 4.2-kbp dsRNA and a 3.4-kbp dsDNA tether. Linear fits to the data (lines) indicate that the dsDNA lengthens by ∼0.5 nm per turn, whereas the dsRNA shortens by ∼0.8 nm per turn upon overwinding. Symbols denote the mean and standard deviation for four measurements on the same molecule. (C) Slopes upon overwinding of dsRNA and dsDNA tethers as a function of F (mean and SEM of at least four molecules in TE + 100 mM NaCl buffer). Data of Lionnet et al. (38) are shown as a black line with the uncertainty indicated in gray; data from Gore et al. (39) are shown as a black square. The red line is the average over all dsRNA data. (D) Models of oppositely twisting 50-bp segments of dsDNA (Left) and dsRNA (Right) under 0 and 40 pN stretching forces, derived from base pair-level models consistent with experimental measurements (SI Appendix, Table S6 and Materials and Methods). The orange bars represent the long axis of the terminal base pair.
Fig. 5.
Fig. 5.
Slow buckling transition for dsRNA. (A) Time traces of the extension of a 4.2-kbp dsRNA tether for varying numbers of applied turns (indicated on the far right) at the buckling transition for F = 2 pN in 320 mM NaCl. (Right) Extension histograms (in gray) fitted by double Gaussians (brown lines). Raw data were acquired at 120 Hz (gray) and data were filtered at 20 Hz (red). (Inset) Schematic of the buckling transition. (B) Fraction of the time spent in the postbuckling state vs. applied turns for the data in A and fit of a two-state model (black line; SI Appendix, Materials and Methods). (C) Mean residence times in the pre- and postbuckling state vs. applied turns for the data in A and fits of an exponential model (lines; SI Appendix, Materials and Methods). (D) Extension vs. time traces for dsRNA (red) and dsDNA (blue) both at F = 4 pN in TE buffer with 320 mM NaCl added. Note the different timescales for dsRNA and dsDNA. (E) Characteristic buckling times for 4.2-kbp dsRNA in TE buffer with 100 mM (red points) and 320 mM (orange points) NaCl added (mean and SEM of at least four independent molecules). Solid lines are fits of an exponential model. Measurements with 3.4-kbp dsDNA tethers in 320 mM NaCl at F = 4 pN yielded characteristic buckling times of ∼50 ms (horizontal dashed line); however, this value represents only an upper limit, because our time resolution for these fast transitions is biased by the acquisition frequency of the CCD camera (120 Hz). For comparison, we show data for 10.9- and 1.9-kbp DNA (upper and lower triangles, respectively) from ref. .

Similar articles

Cited by

References

    1. Tama F, Valle M, Frank J, Brooks CL., III Dynamic reorganization of the functionally active ribosome explored by normal mode analysis and cryo-electron microscopy. Proc Natl Acad Sci USA. 2003;100(16):9319–9323. - PMC - PubMed
    1. Schuwirth BS, et al. Structures of the bacterial ribosome at 3.5 Å resolution. Science. 2005;310(5749):827–834. - PubMed
    1. Alexander RW, Eargle J, Luthey-Schulten Z. Experimental and computational determination of tRNA dynamics. FEBS Lett. 2010;584(2):376–386. - PubMed
    1. Lee G, Bratkowski MA, Ding F, Ke A, Ha T. Elastic coupling between RNA degradation and unwinding by an exoribonuclease. Science. 2012;336(6089):1726–1729. - PMC - PubMed
    1. Guo P. The emerging field of RNA nanotechnology. Nat Nanotechnol. 2010;5(12):833–842. - PMC - PubMed

Publication types