Spatial organization of foreshocks as a tool to forecast large earthquakes
- PMID: 23152938
- PMCID: PMC3497261
- DOI: 10.1038/srep00846
Spatial organization of foreshocks as a tool to forecast large earthquakes
Abstract
An increase in the number of smaller magnitude events, retrospectively named foreshocks, is often observed before large earthquakes. We show that the linear density probability of earthquakes occurring before and after small or intermediate mainshocks displays a symmetrical behavior, indicating that the size of the area fractured during the mainshock is encoded in the foreshock spatial organization. This observation can be used to discriminate spatial clustering due to foreshocks from the one induced by aftershocks and is implemented in an alarm-based model to forecast m > 6 earthquakes. A retrospective study of the last 19 years Southern California catalog shows that the daily occurrence probability presents isolated peaks closely located in time and space to the epicenters of five of the six m > 6 earthquakes. We find daily probabilities as high as 25% (in cells of size 0.04 × 0.04deg(2)), with significant probability gains with respect to standard models.
Figures

 is plotted as function of time from the mainshock. Here ρ(Δr, t) is the linear density probability in the interval [–1.2t, –t] ([t, 1.2t]) before (after) mainshocks for foreshocks (filled circles) and aftershocks (empty diamonds), respectively. We average 1/Δr, instead of Δr, in order to reduce the influence of background seismicity and, for the same reason, we fix Rmax = 3 km. The same symbols as in upper panels are used.
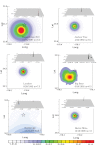
 to have a m > 6 earthquake within 1 day in a cell of side 0.04°, is evaluated for the 6 largest events in Southern California just after the occurrence of the last event before mainshock. For each mainshock, we plot
  over the entire Southern California region (upper panels), and a zoom over a box centered in the future mainshock epicenter (front panels). Black stars indicate the mainshock epicenter location and the values of
  can be obtained from the color code bar.
Similar articles
-
Nucleation and Cascade Features of Earthquake Mainshock Statistically Explored from Foreshock Seismicity.Entropy (Basel). 2019 Apr 19;21(4):421. doi: 10.3390/e21040421. Entropy (Basel). 2019. PMID: 33267135 Free PMC article.
-
The Relevance of Foreshocks in Earthquake Triggering: A Statistical Study.Entropy (Basel). 2019 Feb 13;21(2):173. doi: 10.3390/e21020173. Entropy (Basel). 2019. PMID: 33266889 Free PMC article.
-
Rare Occurrences of Non-cascading Foreshock Activity in Southern California.Geophys Res Lett. 2021 Apr 16;48(7):e2020GL091757. doi: 10.1029/2020GL091757. Epub 2021 Apr 7. Geophys Res Lett. 2021. PMID: 34219839 Free PMC article.
-
Properties of foreshocks and aftershocks of the nonconservative self-organized critical Olami-Feder-Christensen model.Phys Rev E Stat Nonlin Soft Matter Phys. 2004 Oct;70(4 Pt 2):046120. doi: 10.1103/PhysRevE.70.046120. Epub 2004 Oct 28. Phys Rev E Stat Nonlin Soft Matter Phys. 2004. PMID: 15600473
-
Statistical physics models for aftershocks and induced seismicity.Philos Trans A Math Phys Eng Sci. 2018 Nov 26;377(2136):20170397. doi: 10.1098/rsta.2017.0397. Philos Trans A Math Phys Eng Sci. 2018. PMID: 30478209 Free PMC article. Review.
Cited by
-
Optimized Traffic Light System with AIC and Application to the 2021 M6.7 Yangbi Earthquake Sequence.Entropy (Basel). 2023 May 6;25(5):759. doi: 10.3390/e25050759. Entropy (Basel). 2023. PMID: 37238515 Free PMC article.
-
Nucleation and Cascade Features of Earthquake Mainshock Statistically Explored from Foreshock Seismicity.Entropy (Basel). 2019 Apr 19;21(4):421. doi: 10.3390/e21040421. Entropy (Basel). 2019. PMID: 33267135 Free PMC article.
-
The Relevance of Foreshocks in Earthquake Triggering: A Statistical Study.Entropy (Basel). 2019 Feb 13;21(2):173. doi: 10.3390/e21020173. Entropy (Basel). 2019. PMID: 33266889 Free PMC article.
-
Short-Term Foreshocks as Key Information for Mainshock Timing and Rupture: The Mw6.8 25 October 2018 Zakynthos Earthquake, Hellenic Subduction Zone.Sensors (Basel). 2020 Oct 5;20(19):5681. doi: 10.3390/s20195681. Sensors (Basel). 2020. PMID: 33028009 Free PMC article.
-
Were changes in stress state responsible for the 2019 Ridgecrest, California, earthquakes?Nat Commun. 2020 Jun 17;11(1):3082. doi: 10.1038/s41467-020-16867-5. Nat Commun. 2020. PMID: 32555220 Free PMC article.
References
-
- Jordan T. H. et al. Operational earthquake forecasting: State of Knowledge and Guidelines for Utilization. Annals of Geophysics 54(4) (2011)
-
- Jones L. M. & Molnar P. Some characteristic of foreshocks and their possible relationship to earthquake prediction and premonitory silps on faults. J. Geophys. Res. 74, 3596–3608 (1979).
-
- Papazachos B. C. The time distribution of reservoir- associated foreshocks and its importance to the prediction of the principal shock. Bull. Seismol. Soc. Am. 63, 1973–1978 (1973); Foreshocks and earthquakes prediction. Tectonophysics 28, 213–216 (1975).
-
- Kagan Y. Y. & Knopoff L. Statistical short-term earthquake prediction. Science 236, 1563–1467 (1987). - PubMed
-
- Knopoff L., Kagan Y. Y. & Knopoff R. b-values for fore- and aftershocks in real and simulated earthquakes sequences. Bull. Seism. Soc. Am. 72, 1663–1676 (1982).
Publication types
LinkOut - more resources
Full Text Sources


