iBet uBet web content aggregator. Adding the entire web to your favor.


Link to original content: http://pubmed.ncbi.nlm.nih.gov/22179539/
Heart disease and stroke statistics--2012 update: a report from the American Heart Association - PubMed Skip to main page content
U.S. flag

An official website of the United States government

Dot gov

The .gov means it’s official.
Federal government websites often end in .gov or .mil. Before sharing sensitive information, make sure you’re on a federal government site.

Https

The site is secure.
The https:// ensures that you are connecting to the official website and that any information you provide is encrypted and transmitted securely.

Access keys NCBI Homepage MyNCBI Homepage Main Content Main Navigation
Comparative Study

Heart disease and stroke statistics--2012 update: a report from the American Heart Association

Véronique L Roger et al. Circulation. .

Erratum in

  • Circulation. 2012 Jun 5;125(22):e1002
No abstract available


Figures

Chart 2-1
Chart 2-1
Prevalence (unadjusted) estimates for poor, intermediate, and ideal cardiovascular health for each of the 7 metrics of cardiovascular health in the American Heart Association 2020 goals, US children aged 12 to 19 years, National Health and Nutrition Examination Survey (NHANES) 2007–2008 (available data as of June 1, 2011).
Chart 2-2
Chart 2-2
Age-standardized prevalence estimates for poor, intermediate, and ideal cardiovascular health for each of the 7 metrics of cardiovascular health in the American Heart Association 2020 goals, among US adults aged ≥20 years, National Health and Nutrition Examination Survey (NHANES) 2007–2008 (available data as of June 1, 2011).
Chart 2-3
Chart 2-3
Proportion (unadjusted) of US children meeting different numbers of criteria for ideal cardiovascular health, overall and by sex, National Health and Nutrition Examination Survey (NHANES) 2007–2008 (available data as of June 1, 2011). No children meet all 7 criteria.
Chart 2-4
Chart 2-4
Age-standardized prevalence estimates of US adults meeting different numbers of criteria for ideal cardiovascular health, overall and by age and sex subgroups, National Health and Nutrition Examination Survey (NHANES) 2007–2008 (available data as of June 1, 2011). No adults meet all 7 criteria.
Chart 2-5
Chart 2-5
Age-standardized prevalence estimates of US adults meeting different numbers of criteria for ideal cardiovascular health, overall and in selected race subgroups from National Health and Nutrition Examination Survey (NHANES) 2007–2008 (available data as of June 1, 2011). No adults meet all 7 criteria.
Chart 2-6
Chart 2-6
Prevalence estimates of meeting at least 5 criteria for ideal cardiovascular health, US adults (age-standardized), overall and by sex and race, and US children (unadjusted), by sex, National Health and Nutrition Examination Survey (NHANES) 2007–2008 (available data as of June 1, 2011). No adults meet all 7 criteria.
Chart 2-7
Chart 2-7
Age-standardized prevalence estimates of US adults meeting different numbers of cardiovascular health criteria for ideal and poor cardiovascular health, among US adults aged ≥20 years, National Health and Nutrition Examination Survey (NHANES) 2007–2008 (available data as of June 1, 2011).
Chart 2-8
Chart 2-8
US age-standardized death rates attributable to cardiovascular diseases, 2006 and 2007. CVD indicates cardiovascular disease; CHD, coronary heart disease. Total CVD, International Classification of Diseases, 10th Revision (ICD-10) I00–I99; stroke, ICD-10 I60–I69; CHD, ICD-10 I20–I25; other CVD, ICD-10 I00–I15, I26–I51, I70–I78, I80–I89, I95–I99. Data derived from Heron et al and Xu et al.
Chart 2-9
Chart 2-9
Incidence of cardiovascular disease according to the number of ideal health behaviors and health factors. Reprinted from Folsom et al with permission of the publisher. Copyright © 2011, American College of Cardiology Foundation.
Chart 3-1
Chart 3-1
Prevalence of cardiovascular disease in adults ≥20 years of age by age and sex (National Health and Nutrition Examination Survey: 2005–2008). Source: National Center for Health Statistics and National Heart, Lung, and Blood Institute. These data include coronary heart disease, heart failure, stroke, and hypertension.
Chart 3-2
Chart 3-2
Incidence of cardiovascular disease* by age and sex (Framingham Heart Study, 1980–2003). *Coronary heart disease, heart failure, stroke, or intermittent claudication. Does not include hypertension alone. Source: National Heart, Lung, and Blood Institute.
Chart 3-3
Chart 3-3
Deaths attributable to diseases of the heart (United States: 1900–2008). See Glossary (Chapter 25) for an explanation of “diseases of the heart.” Note: In the years 1900–1920, the International Classification of Diseases codes were 77–80; for 1925, 87–90; for 1930–1945, 90–95; for 1950–1960, 402–404, 410–443; for 1965, 402–404, 410–443; for 1970–1975, 390–398, 404–429; for 1980–1995, 390–398, 402, 404–429; and for 2000–2008, I00–I09, I11, I13, I20–I51. Before 1933, data are for a death registration area and not the entire United States. In 1900, only 10 states were in the death registration area, and this increased over the years, so part of the increase in numbers of deaths is attributable to an increase in the number of states. Source: National Center for Health Statistics.
Chart 3-4
Chart 3-4
Deaths attributable to cardiovascular disease (United States: 1900–2008). Cardiovascular disease (International Classification of Diseases, 10th Revision codes I00–I99) does not include congenital. Before 1933, data are for a death registration area and not the entire United States. Source: National Center for Health Statistics.
Chart 3-5
Chart 3-5
Percentage breakdown of deaths attributable to cardiovascular disease (United States: 2008). Source: National Heart, Lung, and Blood Institute from National Center for Health Statistics reports and data sets. *Not a true underlying cause. With any mention deaths, heart failure accounts for 35% of cardiovascular disease deaths. Total may not add to 100 because of rounding. Coronary heart disease includes International Classification of Diseases (ICD), 10th Revision codes I20–I25; stroke, I60–I69; heart failure, I50; high blood pressure, I10–I13; diseases of the arteries, I70–I78; and other, all remaining ICD I categories.
Chart 3-6
Chart 3-6
Cardiovascular disease (CVD) deaths vs cancer deaths by age (United States: 2008). Source: National Center for Health Statistics. CVD includes International Classification of Diseases, 10th Revision codes I00–I99, Q20–Q28; and cancer, C00–C97.
Chart 3-7
Chart 3-7
Cardiovascular disease (CVD) and other major causes of death: total, <85 years of age, and ≥85 years of age. Deaths among both sexes, United States, 2008. CLRD indicates chronic lower respiratory disease. Heart disease includes International Classification of Diseases, 10th Revision codes I00–I09, I11, I13, I20–I51; stroke, I60–I69; all other CVD, I10, I12, I15, I70–I99; cancer, C00–C97; CLRD, J40–J47; Alzheimer disease, G30; and accidents, V01–X59, Y85–Y86. Source: National Center for Health Statistics and National Heart, Lung, and Blood Institute.
Chart 3-8
Chart 3-8
Cardiovascular disease (CVD) and other major causes of death in males: total, <85 years of age, and ≥85 years of age. Deaths among males, United States, 2008. CLRD indicates chronic lower respiratory disease. Heart disease includes International Classification of Diseases, 10th Revision codes I00–I09, I11, I13, I20–I51; stroke, I60–I69; all other CVD, I10, I12, I15, I70–I99; cancer, C00–C97; CLRD, J40–J47; and accidents, V01–X59, Y85–Y86. Source: National Center for Health Statistics and National Heart, Lung, and Blood Institute.
Chart 3-9
Chart 3-9
Cardiovascular disease (CVD) and other major causes of death in females: total, <85 years of age, and ≥85 years of age. Deaths among females, United States, 2008. CLRD indicates chronic lower respiratory disease. Heart disease includes International Classification of Diseases, 10th Revision codes I00–I09, I11, I13, I20–I51; stroke, I60–I69; all other CVD, I10, I12, I15, I70–I99; cancer, C00–C97; CLRD, J40–J47; and Alzheimer disease, G30. Source: National Center for Health Statistics and National Heart, Lung, and Blood Institute.
Chart 3-10
Chart 3-10
Cardiovascular disease and other major causes of death for all males and females (United States: 2008). A indicates cardiovascular disease plus congenital cardiovascular disease (International Classification of Diseases, 10th Revision codes I00–I99, Q20–Q28); B, cancer (C00–C97); C, accidents (V01–X59, Y85–Y86); D, chronic lower respiratory disease (J40–J47); E, diabetes mellitus (E10–E14); and F, Alzheimer disease (G30). Source: National Center for Health Statistics and National Heart, Lung, and Blood Institute.
Chart 3-11
Chart 3-11
Cardiovascular disease and other major causes of death for white males and females (United States: 2008). A indicates cardiovascular disease plus congenital cardiovascular disease (International Classification of Diseases, 10th Revision codes I00–I99, Q20–Q28); B, cancer (C00–C97); C, accidents (V01–X59, Y85–Y86); D, chronic lower respiratory disease (J40–J47); E, diabetes mellitus (E10–E14); and F, Alzheimer disease (G30). Source: National Center for Health Statistics and National Heart, Lung, and Blood Institute.
Chart 3-12
Chart 3-12
Cardiovascular disease and other major causes of death for black males and females (United States: 2008). A indicates cardiovascular disease plus congenital cardiovascular disease (International Classification of Diseases, 10th Revision codes I00–I99, Q20–Q28); B, cancer (C00–C97); C, accidents (V01–X59, Y85–Y86); D, assaults (homicide) (U01–U02, X85–Y09, Y87.1); E, diabetes mellitus (E10–E14); and F, nephritis (N00–N07, N17–N19, N25–N27). Source: National Center for Health Statistics and National Heart, Lung, and Blood Institute.
Chart 3-13
Chart 3-13
Cardiovascular disease and other major causes of death for Hispanic or Latino males and females (United States: 2008). A indicates cardiovascular disease plus congenital cardiovascular disease (International Classification of Diseases, 10th Revision codes I00–I99, Q20–Q28); B, cancer (C00–C97); C, accidents (V01–X59, Y85–Y86); D, diabetes mellitus (E10–E14); E, assaults (homicide) (U01–U02, X85–Y09, Y87.1); and F, chronic lower respiratory disease (J40–J47). Source: National Center for Health Statistics and National Heart, Lung, and Blood Institute.
Chart 3-14
Chart 3-14
Cardiovascular disease and other major causes of death for Asian or Pacific Islander males and females (United States: 2008). “Asian or Pacific Islander” is a heterogeneous category that includes people at high cardiovascular disease risk (eg, South Asian) and people at low cardiovascular disease risk (eg, Japanese). More specific data on these groups are not available. A indicates cardiovascular disease plus congenital cardiovascular disease (International Classification of Diseases, 10th Revision codes I00–I99, Q20–Q28); B, cancer (C00–C97); C, accidents (V01–X59, Y85–Y86); D, diabetes mellitus (E10–E14); E, chronic lower respiratory disease (J40–J47); and F, influenza and pneumonia (J09–J18). Source: National Center for Health Statistics and National Heart, Lung, and Blood Institute.
Chart 3-15
Chart 3-15
Cardiovascular disease and other major causes of death for American Indian or Alaska Native males and females (United States: 2008). A indicates cardiovascular disease plus congenital cardiovascular disease (International Classification of Diseases, 10th Revision codes I00–I99, Q20–Q28); B, cancer (C00–C97); C, accidents (V01–X59, Y85–Y86); D, chronic liver disease (K70, K73–K74); E, diabetes mellitus (E10–E14); and F, chronic lower respiratory disease (J40–J47). Source: National Center for Health Statistics.
Chart 3-16
Chart 3-16
Age-adjusted death rates for coronary heart disease (CHD), stroke, and lung and breast cancer for white and black females (United States: 2008). CHD includes International Classification of Diseases, 10th Revision codes I20–I25; stroke, I60–I69; lung cancer, C33–C34; and breast cancer, C50. Source: National Center for Health Statistics.
Chart 3-17
Chart 3-17
Cardiovascular disease mortality trends for males and females (United States: 1979–2008). Cardiovascular disease excludes congenital cardiovascular defects (International Classification of Diseases, 10th Revision [ICD-10] codes I00–I99). The overall comparability for cardiovascular disease between the International Classification of Diseases, 9th Revision (1979–1998) and ICD-10 (1999–2008) is 0.9962. No comparability ratios were applied. Source: National Center for Health Statistics.
Chart 3-18
Chart 3-18
Hospital discharges for cardiovascular disease (United States: 1970–2009). Hospital discharges include people discharged alive, dead, and “status unknown.” Source: National Center for Health Statistics and National Heart, Lung, and Blood Institute.
Chart 3-19
Chart 3-19
Hospital discharges for the 10 leading diagnostic groups (United States: 2009). Source: National Hospital Discharge Survey/National Center for Health Statistics and National Heart, Lung, and Blood Institute.
Chart 3-20
Chart 3-20
Estimated average 10-year cardiovascular disease risk in adults 50 to 54 years of age according to levels of various risk factors (Framingham Heart Study). HDL indicates high-density lipoprotein; BP, blood pressure. Data derived from D’Agostino et al, with permission of the publisher. Copyright © 2008, American Heart Association.
Chart 3-21
Chart 3-21
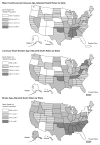
US maps corresponding to state death rates (including the District of Columbia).
Chart 4-1
Chart 4-1
Prevalence (%) of coronary calcium: US adults 33 to 45 years of age. P<0.0001 across race-sex groups. Data derived from Loria et al.
Chart 4-2
Chart 4-2
Prevalence (%) of coronary calcium: US adults 45 to 84 years of age. P<0.0001 across ethnic groups in both men and women. Data derived from Bild et al.
Chart 4-3
Chart 4-3
Hazard ratios (HRs) for coronary heart disease (CHD) events associated with coronary calcium scores: US adults 45 to 84 years of age (reference group: coronary artery calcification [CAC]=0). All HRs P<0.0001. Major CHD events included myocardial infarction and death attributable to CHD; any CHD events included major CHD events plus definite angina or definite or probable angina followed by revascularization. Data derived from Detrano et al.
Chart 4-4
Chart 4-4
Hazard ratios (HRs) for coronary heart disease events associated with coronary calcium scores: US adults (reference group: coronary artery calcification [CAC]=0 and Framingham Risk Score <10%). Coronary heart disease events included nonfatal myocardial infarction and death attributable to coronary heart disease. Data derived from Greenland et al.
Chart 4-5
Chart 4-5
Mean values of carotid intima-media thickness (IMT) for different carotid artery segments in younger adults by race and sex (Bogalusa Heart Study). Data derived from Urbina et al.
Chart 4-6
Chart 4-6
Mean values of carotid intima-media thickness (IMT) for different carotid artery segments in older adults, by race. Data derived from Manolio et al.
Chart 5-1
Chart 5-1
Prevalence of coronary heart disease by age and sex (National Health and Nutrition Examination Survey: 2005–2008). Source: National Center for Health Statistics and National Heart, Lung, and Blood Institute.
Chart 5-2
Chart 5-2
Annual number of adults having diagnosed heart attack or fatal coronary heart disease (CHD) by age and sex (Atherosclerosis Risk in Communities Surveillance: 1987–2004 and Cardiovascular Health Study: 1989–2004). These data include myocardial infarction (MI) and fatal coronary heart disease but not silent MI. Source: National Heart, Lung, and Blood Institute.
Chart 5-3
Chart 5-3
Annual rate of first heart attacks by age, sex, and race (Atherosclerosis Risk in Communities Surveillance: 1987–2004). Source: National Heart, Lung, and Blood Institute.
Chart 5-4
Chart 5-4
Incidence of myocardial infarction* by age, race, and sex (Atherosclerosis Risk in Communities Surveillance, 1987–2004). *Myocardial infarction diagnosis by expert committee based on review of hospital records. Source: Unpublished data from Atherosclerosis Risk in Communities study, National Heart, Lung, and Blood Institute.
Chart 5-5
Chart 5-5
Incidence of angina pectoris* by age and sex (Framingham Heart Study 1980–2002/2003). *Angina pectoris considered uncomplicated on the basis of physician interview of patient. (Rate for women 45–54 years of age considered unreliable.) Data derived from National Heart, Lung, and Blood Institute.
Chart 5-6
Chart 5-6
Estimated 10-year coronary heart disease risk in adults 55 years of age according to levels of various risk factors (Framingham Heart Study). HDL-C indicates high-density lipoprotein cholesterol. Data derived from Wilson et al.
Chart 5-7
Chart 5-7
Hospital discharges for coronary heart disease by sex (United States: 1970–2009). Hospital discharges include people discharged alive, dead, and “status unknown.” Source: National Hospital Discharge Survey/National Center for Health Statistics and National Heart, Lung, and Blood Institute.
Chart 5-8
Chart 5-8
Prevalence of low coronary heart disease risk, overall and by sex (National Health and Nutrition Examination Survey: 1971–2006). Low risk is defined as systolic blood pressure <120 mm Hg and diastolic blood pressure <80 mm Hg; cholesterol <200 mg/dL; body mass index <25 kg/m2; currently not smoking cigarettes; and no prior myocardial infarction or diabetes mellitus. Source: Personal communication with the National Heart, Lung, and Blood Institute, June 28, 2007.
Chart 6-1
Chart 6-1
Prevalence of stroke by age and sex (National Health and Nutrition Examination Survey: 2005–2008). Source: National Center for Health Statistics and National Heart, Lung, and Blood Institute.
Chart 6-2
Chart 6-2
Annual age-adjusted incidence of first-ever stroke by race. Hospital plus out-of-hospital ascertainment, 1993–1994, 1999 and 2005. Data derived from Kleindorfer et al.
Chart 6-3
Chart 6-3
Annual rate of first cerebral infarction by age, sex, and race (Greater Cincinnati/Northern Kentucky Stroke Study: 1999). Rates for black men and women 45 to 54 years of age and for black men ≥75 years of age are considered unreliable. Source: Unpublished data from the Greater Cincinnati/Northern Kentucky Stroke Study.
Chart 6-4
Chart 6-4
Annual rate of all first-ever strokes by age, sex, and race (Greater Cincinnati/Northern Kentucky Stroke Study: 1999). Rates for black men and women 45 to 54 years of age and for black men ≥75 years of age are considered unreliable.
Chart 6-5
Chart 6-5
Age-adjusted incidence of stroke/transient ischemic attack by race and sex, ages 45–74 Atherosclerosis Risk in Communities study cohort, 1987–2001. Data derived from National Heart, Lung, and Blood Institute, Incidence and Prevalence Chart Book, 2006.
Chart 6-6
Chart 6-6
Age-adjusted death rates for stroke by sex and race/ethnicity, 2008. Death rates for the American Indian/Alaska Native and Asian or Pacific Islander populations are known to be underestimated. Stroke includes International Classification of Diseases, 10th Revision codes I60 to I69 (cerebrovascular disease). Source: National Center for Health Statistics and National Heart, Lung, and Blood Institute.
Chart 6-7
Chart 6-7
Stroke death rates, 2000–2006: adults ≥35 years of age, by county. Rates are spatially smoothed to enhance the stability of rates in counties with small populations. International Classification of Diseases, 10th Revision codes for stroke: I60–I69. Data source: National Vital Statistics System and the US Census Bureau.
Chart 6-8
Chart 6-8
Estimated 10-year stroke risk in adults 55 years of age according to levels of various risk factors (Framingham Heart Study). AF indicates atrial fibrillation; CVD, cardiovascular disease. Data derived from Wolf et al with permission of the publisher. Copyright © 1991, American Heart Association.
Chart 6-9
Chart 6-9
Proportion of patients dead 1 year after first stroke. Source: pooled data from the Framingham Heart Study, Atherosclerosis Risk in Communities study, and Cardiovascular Health Study of the National Heart, Lung, and Blood Institute.
Chart 6-10
Chart 6-10
Proportion of patients dead within 5 years after first stroke. Source: pooled data from the Framingham Heart Study, Atherosclerosis Risk in Communities study, and Cardiovascular Health Study of the National Heart, Lung, and Blood Institute.
Chart 6-11
Chart 6-11
Proportion of patients with recurrent stroke in 5 years after first stroke. Source: pooled data from the Framingham Heart Study, Atherosclerosis Risk in Communities study, and Cardiovascular Health Study of the National Heart, Lung, and Blood Institute.
Chart 6-12
Chart 6-12
Trends in carotid endarterectomy procedures (United States: 1980–2009). Source: National Hospital Discharge Survey/National Center for Health Statistics and National Heart, Lung, and Blood Institute.
Chart 6-13
Chart 6-13
Trends in carotid revascularization procedures. MCBEs indicates Medicare beneficiaries; CEA, carotid endarterectomy; and CAS, carotid artery stenting. Reproduced with permission from Goodney et al. Copyright © 2008, American Medical Association. All rights reserved.
Chart 7-1
Chart 7-1
Prevalence of high blood pressure in adults ≥20 years of age by age and sex (National Health and Nutrition Examination Survey: 2005–2008). Hypertension is defined as systolic blood pressure >140 mm Hg or diastolic blood pressure >90 mm Hg, taking antihypertensive medication, or being told twice by a physician or other professional that one has hypertension. Source: National Center for Health Statistics and National Heart, Lung, and Blood Institute.
Chart 7-2
Chart 7-2
Age-adjusted prevalence trends for high blood pressure in adults ≥20 years of age by race/ethnicity, sex, and survey (National Health and Nutrition Examination Survey: 1988–1994, 1999–2004, and 2005–2008). NH indicates non-Hispanic. Source: National Center for Health Statistics and National Heart, Lung, and Blood Institute.
Chart 7-3
Chart 7-3
Extent of awareness, treatment, and control of high blood pressure by race/ethnicity (National Health and Nutrition Examination Survey: 2005–2008). NH indicates non-Hispanic. Source: National Center for Health Statistics and National Heart, Lung, and Blood Institute.
Chart 7-4
Chart 7-4
Extent of awareness, treatment, and control of high blood pressure by age (National Health and Nutrition Examination Survey: 2005–2008). Source: National Center for Health Statistics and National Heart, Lung, and Blood Institute.
Chart 7-5
Chart 7-5
Extent of awareness, treatment, and control of high blood pressure by race/ethnicity and sex (National Health and Nutrition Examination Survey: 1999–2008). NH indicates non-Hispanic. Source: National Center for Health Statistics and National Heart, Lung, and Blood Institute.
Chart 9-1
Chart 9-1
Prevalence of heart failure by sex and age (National Health and Nutrition Examination Survey: 2005–2008). Source: National Center for Health Statistics and National Heart, Lung, and Blood Institute.
Chart 9-2
Chart 9-2
Incidence of heart failure (heart failure based on physician review of medical records and strict diagnostic criteria) by age and sex (Framingham Heart Study: 1980–2003). Source: National Heart, Lung, and Blood Institute.
Chart 9-3
Chart 9-3
Hospital discharges for heart failure by sex (United States: 1979–2009). Note: Hospital discharges include people discharged alive, dead, and status unknown. Source: National Hospital Discharge Survey/National Center for Health Statistics and National Heart, Lung, and Blood Institute.
Chart 13-1
Chart 13-1
Prevalence (%) of students in grades 9 to 12 reporting current cigarette use by sex and race/ethnicity (Youth Risk Behavior Surveillance System, 2009). NH indicates non-Hispanic. Data derived from MMWR: Morbidity and Mortality Weekly Report.
Chart 13-2
Chart 13-2
Prevalence (%) of current smoking for adults >18 years of age by race/ethnicity and sex (National Health Interview Survey: 2007–2009). All percentages are age adjusted. NH indicates non-Hispanic. *Includes both Hispanics and non-Hispanics. Data derived from Centers for Disease Control and Prevention/National Center for Health Statistics, Health Data Interactive.
Chart 14-1
Chart 14-1
Trends in mean total serum cholesterol among adolescents 12 to 17 years of age by race, sex, and survey year (National Health and Nutrition Examination Survey: 1988–1994,* 1999–2004, and 2005–2008). Values are in mg/dL. NH indicates non-Hispanic; Mex. Am., Mexican American. *Data for Mexican Americans not available. Source: National Center for Health Statistics and National Heart, Lung, and Blood Institute.
Chart 14-2
Chart 14-2
Trends in mean total serum cholesterol among adults ≥20 years of age by race and survey year (National Health and Nutrition Examination Survey: 1988–1994, 1999–2004, and 2005–2008). Values are in mg/dL. NH indicates non-Hispanic. Source: National Center for Health Statistics and National Heart, Lung, and Blood Institute.
Chart 14-3
Chart 14-3
Age-adjusted trends in the prevalence of total serum cholesterol >200 mg/dL in adults ≥20 years of age by sex, race/ethnicity, and survey year (National Health and Nutrition Examination Survey 2003–2004, 2005–2006, and 2007–2008). NH indicates non-Hispanic; Mex. Am., Mexican American.
Chart 15-1
Chart 15-1
Prevalence of students in grades 9 through 12 who met currently recommended levels of physical activity during the past 7 days by race/ethnicity and sex (Youth Risk Behavior Surveillance: 2009). “Currently recommended levels” was defined as activity that increased their heart rate and made them breathe hard some of the time for a total of at least 60 minutes per day on 5 of the 7 days preceding the survey. NH indicates non-Hispanic. Data derived from MMWR Surveillance Summaries.
Chart 15-2
Chart 15-2
Prevalence of meeting the 2008 Federal physical activity guidelines among adults ≥18 years of age by race/ethnicity and sex (National Health Interview Survey: 2010). NH indicates non-Hispanic. Percents are age adjusted. Meeting the 2008 Federal physical activity guidelines is defined as engaging in moderate leisure-time physical activity for at least 150 minutes per week or vigorous activity at least 75 minutes per week or an equivalent combination. Source: Schiller et al.
Chart 15-3
Chart 15-3
Prevalence of students in grades 9 to 12 who did not participate in at least 60 minutes of physical activity on any day by race/ethnicity and sex (Youth Risk Behavior Surveillance: 2009). NH indicates non-Hispanic. Data derived from MMWR Surveillance Summaries.
Chart 15-4
Chart 15-4
Prevalence of children 6 to 19 years of age who attained sufficient moderate-to-vigorous physical activity to meet public health recommendations (≥60 minutes per day on 5 or more of the 7 days preceding the survey), by sex and age (National Health and Nutrition Examination Survey: 2003–2004). Source: Troiano et al.
Chart 16-1
Chart 16-1
Prevalence of overweight and obesity among students in grades 9 through 12 by sex and race/ethnicity. NH indicates non-Hispanic. Data derived from Youth Risk Behavior Surveillance–United States, 2009, Table 90.
Chart 16-2
Chart 16-2
Age-adjusted prevalence of obesity in adults 20 to 74 years of age by sex and survey year (National Health Examination Survey: 1960–1962; National Health and Nutrition Examination Survey: 1971–1974, 1976–1980, 1988–1994, 1999–2002, and 2005–2008). Obesity is defined as a body mass index of 30.0 kg/m2. Data derived from Health, United States, 2010 (National Center for Health Statistics).
Chart 16-3
Chart 16-3
Trends in the prevalence of obesity among US children and adolescents by age and survey year (National Health and Nutrition Examination Survey: 1971–1974, 1976–1980, 1988–1994, 1999–2002 and 2005–2008). Data derived from Health, United States, 2010 (National Center for Health Statistics).
Chart 17-1
Chart 17-1
Age-adjusted prevalence of physician-diagnosed diabetes mellitus in adults ≥20 years of age by race/ethnicity and sex (National Health and Nutrition Examination Survey: 2005–2008). NH indicates non-Hispanic. Source: National Center for Health Statistics and National Heart, Lung, and Blood Institute.
Chart 17-2
Chart 17-2
Age-adjusted prevalence of physician-diagnosed type 2 diabetes mellitus in adults ≥20 years of age by race/ethnicity and years of education (National Health and Nutrition Examination Survey: 2005–2008). NH indicates non-Hispanic. Source: National Center for Health Statistics and National Heart, Lung, and Blood Institute.
Chart 17-3
Chart 17-3
Trends in diabetes mellitus prevalence in adults ≥20 years of age by sex (National Health and Nutrition Examination Survey: 1988–1994 and 2005–2008). Source: National Center for Health Statistics, National Heart, Lung, and Blood Institute.
Chart 17-4
Chart 17-4
Diabetes mellitus awareness, treatment, and control (National Health and Nutrition Examination Survey: 2005–2008). Source: National Heart, Lung, and Blood Institute.
Chart 20-1
Chart 20-1
Age-adjusted trends in macronutrients and total calories consumed by US adults (20–74 years of age), 1971–2004. Data derived from National Center for Health Statistics.
Chart 20-2
Chart 20-2
Per capita calories consumed from different beverages by US adults (19 years of age), 1965–2002. Data derived from Nationwide Food Consumption Surveys (1965, 1977–1978), National Health and Nutrition Examination Survey (1988–1994, 1999–2002), and Duffey and Popkin.
Chart 20-3
Chart 20-3
Total US food expenditures away from home and at home, 1977 and 2007. Data derived from US Department of Agriculture Economic Research Service.
Chart 22-1
Chart 22-1
Trends in heart transplantations (United Network for Organ Sharing: 1975–2010). Source: United Network for Organ Sharing, scientific registry data.
Chart 22-2
Chart 22-2
Trends in cardiovascular procedures, United States: 1979–2009. PCI indicates percutaneous coronary intervention. Note: Inpatient procedures only. Source: National Hospital Discharge Survey, National Center for Health Statistics, and National Heart, Lung, and Blood Institute.
Chart 22-3
Chart 22-3
Number of surgical procedures in the 10 leading diagnostic groups, United States: 2009. Source: National Hospital Discharge Survey/National Center for Health Statistics and National Heart, Lung, and Blood Institute.
Chart 23-1
Chart 23-1
Direct and indirect costs (in billions of dollars) of major cardiovascular diseases (CVD) and stroke (United States: 2008). Source: National Heart, Lung, and Blood Institute.
Chart 23-2
Chart 23-2
The 20 leading diagnoses for direct health expenditures, United States, 2008 (in billions of dollars). COPD indicates chronic obstructive pulmonary disease; GI, gastrointestinal tract. Source: National Heart, Lung, and Blood Institute; estimates are from the Medical Expenditure Panel Survey, Agency for Healthcare Research and Quality, and exclude nursing home costs.
Chart 23-3
Chart 23-3
Projected total costs of cardiovascular disease (CVD), 2015–2030 (in billions 2008$) in the United States. CHD indicates coronary heart disease; HF, heart failure. Data derived from Heidenreich et al with permission of the publisher. Copyright © 2011, American Heart Association.
Chart 23-4
Chart 23-4
Projected total (direct and indirect) costs of total cardiovascular disease by age (2010 $ in billions). Unpublished data tabulated by American Heart Association using methods described in Heidenreich et al.

Comment in

Similar articles

  • Executive summary: heart disease and stroke statistics--2012 update: a report from the American Heart Association.
    Roger VL, Go AS, Lloyd-Jones DM, Benjamin EJ, Berry JD, Borden WB, Bravata DM, Dai S, Ford ES, Fox CS, Fullerton HJ, Gillespie C, Hailpern SM, Heit JA, Howard VJ, Kissela BM, Kittner SJ, Lackland DT, Lichtman JH, Lisabeth LD, Makuc DM, Marcus GM, Marelli A, Matchar DB, Moy CS, Mozaffarian D, Mussolino ME, Nichol G, Paynter NP, Soliman EZ, Sorlie PD, Sotoodehnia N, Turan TN, Virani SS, Wong ND, Woo D, Turner MB; American Heart Association Statistics Committee and Stroke Statistics Subcommittee. Roger VL, et al. Circulation. 2012 Jan 3;125(1):188-97. doi: 10.1161/CIR.0b013e3182456d46. Circulation. 2012. PMID: 22215894 No abstract available.
  • Heart Disease and Stroke Statistics-2016 Update: A Report From the American Heart Association.
    Writing Group Members; Mozaffarian D, Benjamin EJ, Go AS, Arnett DK, Blaha MJ, Cushman M, Das SR, de Ferranti S, Després JP, Fullerton HJ, Howard VJ, Huffman MD, Isasi CR, Jiménez MC, Judd SE, Kissela BM, Lichtman JH, Lisabeth LD, Liu S, Mackey RH, Magid DJ, McGuire DK, Mohler ER 3rd, Moy CS, Muntner P, Mussolino ME, Nasir K, Neumar RW, Nichol G, Palaniappan L, Pandey DK, Reeves MJ, Rodriguez CJ, Rosamond W, Sorlie PD, Stein J, Towfighi A, Turan TN, Virani SS, Woo D, Yeh RW, Turner MB; American Heart Association Statistics Committee; Stroke Statistics Subcommittee. Writing Group Members, et al. Circulation. 2016 Jan 26;133(4):e38-360. doi: 10.1161/CIR.0000000000000350. Epub 2015 Dec 16. Circulation. 2016. PMID: 26673558 No abstract available.
  • Heart disease and stroke statistics--2009 update: a report from the American Heart Association Statistics Committee and Stroke Statistics Subcommittee.
    Lloyd-Jones D, Adams R, Carnethon M, De Simone G, Ferguson TB, Flegal K, Ford E, Furie K, Go A, Greenlund K, Haase N, Hailpern S, Ho M, Howard V, Kissela B, Kittner S, Lackland D, Lisabeth L, Marelli A, McDermott M, Meigs J, Mozaffarian D, Nichol G, O'Donnell C, Roger V, Rosamond W, Sacco R, Sorlie P, Stafford R, Steinberger J, Thom T, Wasserthiel-Smoller S, Wong N, Wylie-Rosett J, Hong Y; American Heart Association Statistics Committee and Stroke Statistics Subcommittee. Lloyd-Jones D, et al. Circulation. 2009 Jan 27;119(3):480-6. doi: 10.1161/CIRCULATIONAHA.108.191259. Circulation. 2009. PMID: 19171871 No abstract available.
  • Heart disease and stroke statistics--2013 update: a report from the American Heart Association.
    Go AS, Mozaffarian D, Roger VL, Benjamin EJ, Berry JD, Borden WB, Bravata DM, Dai S, Ford ES, Fox CS, Franco S, Fullerton HJ, Gillespie C, Hailpern SM, Heit JA, Howard VJ, Huffman MD, Kissela BM, Kittner SJ, Lackland DT, Lichtman JH, Lisabeth LD, Magid D, Marcus GM, Marelli A, Matchar DB, McGuire DK, Mohler ER, Moy CS, Mussolino ME, Nichol G, Paynter NP, Schreiner PJ, Sorlie PD, Stein J, Turan TN, Virani SS, Wong ND, Woo D, Turner MB; American Heart Association Statistics Committee and Stroke Statistics Subcommittee. Go AS, et al. Circulation. 2013 Jan 1;127(1):e6-e245. doi: 10.1161/CIR.0b013e31828124ad. Epub 2012 Dec 12. Circulation. 2013. PMID: 23239837 Free PMC article. Review. No abstract available.
  • Heart Disease and Stroke Statistics-2018 Update: A Report From the American Heart Association.
    Benjamin EJ, Virani SS, Callaway CW, Chamberlain AM, Chang AR, Cheng S, Chiuve SE, Cushman M, Delling FN, Deo R, de Ferranti SD, Ferguson JF, Fornage M, Gillespie C, Isasi CR, Jiménez MC, Jordan LC, Judd SE, Lackland D, Lichtman JH, Lisabeth L, Liu S, Longenecker CT, Lutsey PL, Mackey JS, Matchar DB, Matsushita K, Mussolino ME, Nasir K, O'Flaherty M, Palaniappan LP, Pandey A, Pandey DK, Reeves MJ, Ritchey MD, Rodriguez CJ, Roth GA, Rosamond WD, Sampson UKA, Satou GM, Shah SH, Spartano NL, Tirschwell DL, Tsao CW, Voeks JH, Willey JZ, Wilkins JT, Wu JH, Alger HM, Wong SS, Muntner P; American Heart Association Council on Epidemiology and Prevention Statistics Committee and Stroke Statistics Subcommittee. Benjamin EJ, et al. Circulation. 2018 Mar 20;137(12):e67-e492. doi: 10.1161/CIR.0000000000000558. Epub 2018 Jan 31. Circulation. 2018. PMID: 29386200 Review. No abstract available.

Cited by

References

    1. US Census Bureau population estimates. [Accessed October 30, 2011]; http://www.census.gov/popest/national/
    1. National Center for Health Statistics. Health, United States, 2009, With Special Feature on Medical Technology. Hyattsville, MD: National Center for Health Statistics; 2010. [Accessed July 30, 2010]. http://www.cdc.gov/nchs/data/hus/hus09.pdf. - PubMed
    1. National Center for Health Statistics, Centers for Medicare and Medicaid Services. International Classification of Diseases, Ninth Revision: Clinical Modification (ICD-9-CM) Hyattsville, MD: National Center for Health Statistics; 1978.
    1. Anderson RN, Rosenberg HM. Age standardization of death rates: implementation of the year 2000 standard. Natl Vital Stat Rep. 1998;47:1–16. 20. - PubMed
    1. World Health Organization. World Health Statistics Annual. Geneva, Switzerland: World Health Organization; 1998.

Publication types