iBet uBet web content aggregator. Adding the entire web to your favor.


Link to original content: http://pubmed.ncbi.nlm.nih.gov/19561614/
Immunoglobulin D enhances immune surveillance by activating antimicrobial, proinflammatory and B cell-stimulating programs in basophils - PubMed Skip to main page content
U.S. flag

An official website of the United States government

Dot gov

The .gov means it’s official.
Federal government websites often end in .gov or .mil. Before sharing sensitive information, make sure you’re on a federal government site.

Https

The site is secure.
The https:// ensures that you are connecting to the official website and that any information you provide is encrypted and transmitted securely.

Access keys NCBI Homepage MyNCBI Homepage Main Content Main Navigation
. 2009 Aug;10(8):889-98.
doi: 10.1038/ni.1748. Epub 2009 Jun 28.

Immunoglobulin D enhances immune surveillance by activating antimicrobial, proinflammatory and B cell-stimulating programs in basophils

Affiliations

Immunoglobulin D enhances immune surveillance by activating antimicrobial, proinflammatory and B cell-stimulating programs in basophils

Kang Chen et al. Nat Immunol. 2009 Aug.

Abstract

Immunoglobulin D (IgD) is an enigmatic antibody isotype that mature B cells express together with IgM through alternative RNA splicing. Here we report active T cell-dependent and T cell-independent IgM-to-IgD class switching in B cells of the human upper respiratory mucosa. This process required activation-induced cytidine deaminase (AID) and generated local and circulating IgD-producing plasmablasts reactive to respiratory bacteria. Circulating IgD bound to basophils through a calcium-mobilizing receptor that induced antimicrobial, opsonizing, inflammatory and B cell-stimulating factors, including cathelicidin, interleukin 1 (IL-1), IL-4 and B cell-activating factor (BAFF), after IgD crosslinking. By showing dysregulation of IgD class-switched B cells and 'IgD-armed' basophils in autoinflammatory syndromes with periodic fever, our data indicate that IgD orchestrates an ancestral surveillance system at the interface between immunity and inflammation.


Figures
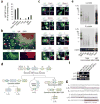
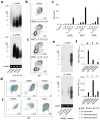
Figure 1
Figure 1. Upper respiratory mucosa B cells generate IgD+IgM plasmablasts by undergoing Cμ-to-Cδ CSR in situ
(a) Proportion of IgD+IgM plasmablasts in various tissues calculated by immunofluorescence as described in Methods. PLN, peripheral lymph nodes; BM, bone marrow. (b) Tonsil tissue stained for IgD (green) and IgM (red). DAPI (blue) counterstains nuclei. Arrowheads point to IgD+IgM plasmablasts. Original magnification ×10. (c) Representative IgD+IgM B cells from tonsils stained for IgD (green), Pax-5, Blimp-1, BCMA, CD138, κ, λ, AID or CD19 (red), and IgM or DAPI (blue). (d) Diagram of CSR from Sμ to σδ. Germline Iμ-Cμ and Iμ-Cδ transcripts, σδ-Sμ switch circles, and post-switched Iμ-Cδ transcripts are shown. Arrows indicate primers. (e) Southern blots of σδ-Sμ switch circles PCR amplified from mononuclear cells of various tissues and hybridized with σδ or Sμ probes. Rightmost lane shows a typical multi-banded σδ-Sμ smear in enriched tonsillar IgD+ B cells. Kb, kilobases. (f) Germline Iμ-Cμ transcripts and germline or post-switch Iμ-Cδ transcripts in Reh IgDIgM+ pre-B-like cells, 2E2 pre-germinal center IgD+IgM+ B cells, Ramos germinal center-like IgDIgM+ B cells, and MM-M1 IgD+IgM plasma cells. Genomic β-actin is a loading control. (g) Representative σδ-Sμ and Iμ-Cδ DNA sequences from tonsillar IgD+IgM and IgD+IgM+ B cells, respectively. Panel a summarizes 1 of 3 experiments (bars indicate s.e.m.), whereas panels b, c, d, f, g and h show 1 of 5 experiments yielding similar results.
Figure 2
Figure 2. Cμ-to-Cδ CSR occurs through both TD and TI pathways, requires AID, and leads to the production of IgD antibodies that bind to respiratory bacteria
(a) σδ-Sμ switch circles from circulating IgD+IgM+ B cells stimulated with or without CD40L, BAFF or APRIL plus IL-15 and IL-21 for 4 d. Genomic β-actin is a loading control. Kb, kilobases. (b, c) Flow cytometric analysis of surface IgD and IgM and ELISA of secreted IgD from circulating IgD+IgM+ B cells stimulated as in a for 7 d. Control indicates medium alone. (d) Percentage of circulating IgD+IgM B cells in a healthy donor and patients with TNFSF5 (HIGM1), AICDA (HIGM2), TNFRSF5 (HIGM3), TNFRSF13b (CVID) or MVK (HIDS) gene defects. (e) Induction of σδ-Sμ switch circles in circulating mononuclear cells from a HIGM2 patient and a control healthy donor incubated with medium alone (control) or BAFF, IL-15 and IL-21 (stimulated) for 4 d. An anti-IgM antibody was added to optimize the activation and expansion of IgD+IgM+ B cells. (f) Binding of secreted IgD to MID, CPS, LPS, M. catarrhalis, and H. influenzae type a or type b as determined by ELISA. IgD secretion was obtained by incubating circulating IgD+IgM+ B cells with or without BAFF, IL-15 and IL-21 for 7 d. Panels a, b, d and e show 1 of 5 experiments yielding similar results, whereas panels c and f summarize 3 experiments (bars indicate s.e.m.; *, p < 0.05).
Figure 3
Figure 3. IgD binds to basophils and mast cells in vivo
(a) Flow cytometric analysis of IgD on circulating or tonsillar CD19+CD3 B cells, CD19CD3+ T cells, CD16highCD56low or CD16lowCD56high NK cells, CD19CD14+ monocytes, CD11c+CD83 or CD11c+CD83+ myeloid dendritic cells (mDCs), CD15+CD123 neutrophils, CD15+CD123low eosinophils, CD123+HLA-DR+ or CD123+FcεRIlow plasmacytoid dendritic cells (pDCs), CD123+HLA-DR or CD123+FcεRI+ basophils, and CD117+FcεRI+ mast cells. Gray and black histograms depict control unstained cells and IgD, respectively. A F(ab’)2 pAb was used to detect IgD. Dead cells were excluded using 7-AAD staining. (b) Immunofluoresence analysis of circulating and tonsillar basophils stained for IgD (green) and FcεRI, CD123 or tryptase (red). DAPI (blue) counterstains lobated nuclei of basophils. A F(ab’)2 pAb was used to detect IgD. (c) Flow cytometry of IgD levels on circulating basophils before (black histogram) and after exposure to exogenous monoclonal IgD (10 μg/ml, brown histogram), treatment with acidic buffer (blue histogram), and treatment with acidic buffer followed by addition of exogenous IgD (red histogram). A F(ab’)2 pAb was used to detect IgD. Unstained basophils were used as control (gray histogram) and dead cells were excluded using 7-AAD staining. (d) Binding of labeled monoclonal IgD to circulating basophils stripped of endogenous IgD and incubated with 0 μg/ml (green histogram), 100 μg/ml (orange histogram) or 500 μg/ml (purple histogram) of unlabelled monoclonal IgD. A F(ab’)2 pAb was used to detect IgD. Unstained basophils were used as control (gray histogram) and dead cells were excluded using 7-AAD staining. Panels a-d show 1 of 5 experiments yielding similar results.
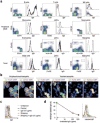
Figure 4
Figure 4. IgD binds to basophilic and mast cell lines in vitro
(a) Binding of monoclonal IgD (50 μg/ml) to various lymphoid and myeloid cell lines. A F(ab’)2 pAb was used to detect IgD. Mo, MC and Basø indicate monocytic, mast cell and basophilic cell lines, respectively. (b) Binding of increasing amounts (0.5, 5 and 50 μg/ml) of monoclonal IgD to the mast cell line HMC-1 and binding of monoclonal IgD (50 μg/ml) to the basophilic cell line KU812 before and after treatment with IL-4 for 1 d and with IL-3 for 4 d. Control indicates medium alone. A F(ab’)2 pAb was used to detect IgD. Gray histogram depicts background fluorescence of cells that were not incubated with monoclonal IgD. (c) Binding of fluorochrome-conjugated monoclonal IgD to HMC-1 or KU812 cells in the presence of increasing amounts (0, 5, 50, 250 or 1000 μg/ml) of unlabeled monoclonal IgD. (d) Binding of untreated or denatured monoclonal IgD (50 μg/ml) to HMC-1 cells pre-incubated or not with IgG, IgA, IgE, mannose, mannan, trypsin, pepsin, papain, or papain plus leupeptin. A F(ab’)2 pAb was used to detect IgD. In all the experiments dead cells were excluded using 7-AAD staining. Panel a summarizes 3 experiments (bars indicate s.e.m.), whereas panels b-d show 1 of 3 experiments yielding similar results.
Figure 5
Figure 5. Basophils release immunostimulating and pro-inflammatory factors upon IgD cross-linking
(a) Flow cytometry of CD63 on basophils exposed to microbeads alone (control), microbead-bound monoclonal anti-IgD, or microbead-bound monoclonal anti-IgE for 30 min or 5 h in the presence or absence of IL-3. (b) ELISA of histamine from basophils exposed to microbeads alone (open bar), microbead-bound monoclonal anti-IgD (gray bar), microbead-bound monoclonal anti-IgE (black bar), or microbead-bound isotype-matched control monoclonal antibody (striped bar) for 30 min in the presence or absence of IL-3. (c) ELISA of IL-4, IL-13 or BAFF from basophils exposed to microbeads alone (open bar), microbead-bound monoclonal anti-IgD (gray bar), or microbead-bound monoclonal anti-IgE (black bar) for 16 h in the presence or absence of IL-3. IL-8 and CXCL10 were measured after 48 h. (d) Intracellular Ca2+ levels of basophils treated as in c. The arrow indicates addition of the cross-linking reagent and 0 sec indicates the start of the kinetic measurement. (e) IgM, IgA and IgG production by peripheral blood IgD+IgM+ B cells exposed for 7 d to basophils treated as in c. Panels a and d show 1 of 3 experiments yielding similar results, whereas panels b, c and e summarize 3 experiments (bars indicate s.e.m.; *, p < 0.01; **, p < 0.001).
Figure 6
Figure 6. Basophils release antimicrobial factors upon IgD cross-linking
(a) QRT-PCR of DEFB103A, CAMP, SPAG11A/F, and SPAG11D/G transcripts from basophils exposed to microbeads alone (control, open bar), microbead-bound monoclonal anti-IgD (gray bar), or microbead-bound monoclonal anti-IgE (black bar) for 6 h. PTX3 and CRP transcripts were measured after 16 h. mRNAs were normalized to ACTB mRNA. (b) ELISA of LL-37 from basophils stimulated as in a in the presence or absence of IL-3 for 8 h. (c) Growth of Moraxella catarrhalis and Haemophilus influenzae type-a and type-b upon 2-h exposure to culture supernatants from basophils stimulated as in a for 8 h or 16 h. CFU, colony forming unit. Panels a-c summarize 3 experiments (bars indicate s.e.m.; *, p < 0.03; **, p < 0.02; ***, p < 0.01).
Figure 7
Figure 7. Increased IgD class-switched plasmablasts and IgD-armed basophils in inflamed tissues from patients with periodic fever syndromes
(a, b) Flow cytometric analysis of circulating IgD+IgM B cells and CD123+HLA-DR basophils in a healthy subject and hyper-IgD patients with MVK (HIDS), unknown (PFAPA), NALP3 (MWS) and TNFRSF1A (TRAPS) gene defects. Numbers indicate percentage of IgD+IgM B cells in CD19+ B cells and of CD123+HLA-DR basophils in mononuclear cells. (c) Immunofluorescence analysis of a tonsil tissue specimen from healthy individual or a PFAPA syndrome patient stained for IgD (green), tryptase (red) and DAPI (blue). Dashed lines demarcate lymphoid follicles. (d) BAFF (green) expression by basophils co-stained for IgD (green), CD123 (red) and FcεRI (blue). Arrowheads show both IgD+CD123 plasmablasts (B) and IgD+CD123+ basophils (Basø). (e) ELISA of TNF and IL-1β from basophils cultured with IL-3 and microbeads alone (control, open bar), microbead-bound monoclonal anti-IgD (gray bar) or microbead-bound monoclonal anti-IgE (black bar) for 48 h in the presence or absence of monocytes. Panels a-d show 1 of 3 experiments yielding similar results, whereas panel e summarizes 3 experiments (bars indicate s.e.m.).

Similar articles

Cited by

References

    1. Rowe DS, Fahey JL. A new class of human immunoglobulins. J Exp Med. 1965;121:171–199. - PMC - PubMed
    1. Butler JE, Sun J, Navarro P. The swine Ig heavy chain locus has a single JH and no identifiable IgD. Int Immunol. 1996;8:1897–1904. - PubMed
    1. Ohta Y, Flajnik M. IgD, like IgM, is a primordial immunoglobulin class perpetuated in most jawed vertebrates. Proc Natl Acad Sci U S A. 2006;103:10723–10728. - PMC - PubMed
    1. Preud’homme JL, et al. Structural and functional properties of membrane and secreted IgD. Mol Immunol. 2000;37:871–887. - PubMed
    1. Bengten E, et al. The IgH locus of the channel catfish, Ictalurus punctatus, contains multiple constant region gene sequences: different genes encode heavy chains of membrane and secreted IgD. J Immunol. 2002;169:2488–2497. - PubMed

Publication types

MeSH terms