Estimating the changes in energy flux that characterize the rise in obesity prevalence
- PMID: 19369382
- PMCID: PMC3738432
- DOI: 10.3945/ajcn.2008.27061
Estimating the changes in energy flux that characterize the rise in obesity prevalence
Abstract
Background: The daily energy imbalance gap associated with the current population weight gain in the obesity epidemic is relatively small. However, the substantially higher body weights of populations that have accumulated over several years are associated with a substantially higher total energy expenditure (TEE) and total energy intake (TEI), or energy flux (EnFlux = TEE = TEI).
Objective: The objective was to develop an equation relating EnFlux to body weight in adults for estimating the rise in EnFlux associated with the obesity epidemic.
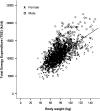
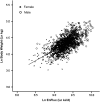
Design: Multicenter, cross-sectional data for TEE from doubly labeled water studies in 1399 adults aged 5.9 +/- 18.8 y (mean +/- SD) were analyzed in linear regression models with natural log (ln) weight as the dependent variable and ln EnFlux as the independent variable, adjusted for height, age, and sex. These equations were compared with those for children and applied to population trends in weight gain.
Results: ln EnFlux was positively related to ln weight (beta = 0.71; 95% CI: 0.66, 0.76; R2 = 0.52), adjusted for height, age, and sex. This slope was significantly steeper than that previously described for children (beta = 0.45; 95% CI: 0.38, 0.51).
Conclusions: This relation suggests that substantial increases in TEI have driven the increases in body weight over the past 3 decades. Adults have a higher proportional weight gain than children for the same proportional increase in energy intake, mostly because of a higher fat content of the weight being gained. The obesity epidemic will not be reversed without large reductions in energy intake, increases in physical activity, or both.
Figures


Comment in
-
How large is the energy gap that accounts for the obesity epidemic?Am J Clin Nutr. 2009 Jun;89(6):1717-8. doi: 10.3945/ajcn.2009.27889. Epub 2009 Apr 29. Am J Clin Nutr. 2009. PMID: 19403628 No abstract available.
-
Estimating the quantitative relation between food energy intake and changes in body weight.Am J Clin Nutr. 2010 Mar;91(3):816; author reply 817. doi: 10.3945/ajcn.2009.28922. Epub 2010 Jan 13. Am J Clin Nutr. 2010. PMID: 20071643 Free PMC article. No abstract available.
-
Energy expenditure and the obesity epidemic.Am J Clin Nutr. 2010 Jun;91(6):1801-2; author reply 1802-4. doi: 10.3945/ajcn.2010.29433. Epub 2010 Apr 21. Am J Clin Nutr. 2010. PMID: 20410099 No abstract available.
Similar articles
-
Estimating the effects of energy imbalance on changes in body weight in children.Am J Clin Nutr. 2006 Apr;83(4):859-63. doi: 10.1093/ajcn/83.4.859. Am J Clin Nutr. 2006. PMID: 16600939
-
Unexplained disturbance in body weight regulation: diagnostic outcome assessed by doubly labeled water and body composition analyses in obese patients reporting low energy intakes.J Am Diet Assoc. 1995 Dec;95(12):1393-400; quiz 1401-2. doi: 10.1016/S0002-8223(95)00367-3. J Am Diet Assoc. 1995. PMID: 7594141
-
Energy expenditure does not predict weight change in either Nigerian or African American women.Am J Clin Nutr. 2009 Jan;89(1):169-76. doi: 10.3945/ajcn.2008.26630. Epub 2008 Dec 3. Am J Clin Nutr. 2009. PMID: 19056567 Free PMC article.
-
Energy gap in the aetiology of body weight gain and obesity: a challenging concept with a complex evaluation and pitfalls.Obes Facts. 2014;7(1):15-25. doi: 10.1159/000357846. Epub 2014 Jan 22. Obes Facts. 2014. PMID: 24457473 Free PMC article. Review.
-
Dietary fat intake and regulation of energy balance: implications for obesity.J Nutr. 2000 Feb;130(2S Suppl):284S-288S. J Nutr. 2000. PMID: 10721889 Review.
Cited by
-
The Retail Food Environment Index and its association with dietary patterns, body mass index, and socioeconomic position: A multilevel assessment in Mexico.PLOS Glob Public Health. 2024 Oct 10;4(10):e0003819. doi: 10.1371/journal.pgph.0003819. eCollection 2024. PLOS Glob Public Health. 2024. PMID: 39388394 Free PMC article.
-
The Potential Effect of Sugar-Sweetened Beverages Tax on Obesity Prevalence in Tanzania.East Afr Health Res J. 2023;7(2):289-301. doi: 10.24248/eahrj.v7i2.743. Epub 2023 Nov 30. East Afr Health Res J. 2023. PMID: 39219654 Free PMC article.
-
The implications of policy modeling assumptions for the projected impact of sugar-sweetened beverage taxation on body weight and type 2 diabetes in Germany.BMC Public Health. 2024 Jul 27;24(1):2013. doi: 10.1186/s12889-024-19488-5. BMC Public Health. 2024. PMID: 39068431 Free PMC article.
-
The milk study protocol: A longitudinal, prospective cohort study of the relationship between human milk metabolic hormone concentration, maternal body composition, and early growth and satiety development in Samoan infants aged 1-4 months.PLoS One. 2024 May 10;19(5):e0292997. doi: 10.1371/journal.pone.0292997. eCollection 2024. PLoS One. 2024. PMID: 38728264 Free PMC article.
-
The health and economic impact and cost effectiveness of interventions for the prevention and control of overweight and obesity in Kenya: a stakeholder engaged modelling study.Cost Eff Resour Alloc. 2023 Sep 21;21(1):69. doi: 10.1186/s12962-023-00467-3. Cost Eff Resour Alloc. 2023. PMID: 37735408 Free PMC article.
References
-
- Brown WJ, Williams L, Ford JH, Ball K, Dobson AJ. Identifying the energy gap: magnitude and determinants of 5-year weight gain in midage women. Obes Res 2005;13:1431–41 - PubMed
-
- Haby MM, Vos T, Carter R, et al. A new approach to assessing the health benefit from obesity interventions in children and adolescents: the assessing cost-effectiveness in obesity project. Int J Obes 2006;30:1463–75 - PubMed
-
- Dolan MS, Weiss LA, Lewis RA, Pietrobelli A, Heo M, Faith MS. ‘Take the stairs instead of the escalator’: effect of environmental prompts on community stair use and implications for a national ‘Small Steps’ campaign. Obes Rev 2006;7:25–32 - PubMed
-
- America on the Move. Available from: http://aom.americaonthemove.org (cited September 2008)
-
- Hill JO, Wyatt HR, Reed GW, Peters JC. Obesity and the environment: where do we go from here? Science 2003;299:853–5 - PubMed
Publication types
MeSH terms
Grants and funding
LinkOut - more resources
Full Text Sources
Other Literature Sources
Medical
Miscellaneous


