Mapping correlations between ventricular expansion and CSF amyloid and tau biomarkers in 240 subjects with Alzheimer's disease, mild cognitive impairment and elderly controls
- PMID: 19236926
- PMCID: PMC2696357
- DOI: 10.1016/j.neuroimage.2009.02.015
Mapping correlations between ventricular expansion and CSF amyloid and tau biomarkers in 240 subjects with Alzheimer's disease, mild cognitive impairment and elderly controls
Abstract
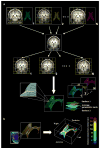
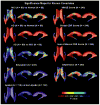
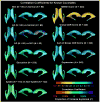
We aimed to improve on the single-atlas ventricular segmentation method of (Carmichael, O.T., Thompson, P.M., Dutton, R.A., Lu, A., Lee, S.E., Lee, J.Y., Kuller, L.H., Lopez, O.L., Aizenstein, H.J., Meltzer, C.C., Liu, Y., Toga, A.W., Becker, J.T., 2006. Mapping ventricular changes related to dementia and mild cognitive impairment in a large community-based cohort. IEEE ISBI. 315-318) by using multi-atlas segmentation, which has been shown to lead to more accurate segmentations (Chou, Y., Leporé, N., de Zubicaray, G., Carmichael, O., Becker, J., Toga, A., Thompson, P., 2008. Automated ventricular mapping with multi-atlas fluid image alignment reveals genetic effects in Alzheimer's disease, NeuroImage 40(2): 615-630); with this method, we calculated minimal numbers of subjects needed to detect correlations between clinical scores and ventricular maps. We also assessed correlations between emerging CSF biomarkers of Alzheimer's disease pathology and localizable deficits in the brain, in 80 AD, 80 mild cognitive impairment (MCI), and 80 healthy controls from the Alzheimer's Disease Neuroimaging Initiative. Six expertly segmented images and their embedded parametric mesh surfaces were fluidly registered to each brain; segmentations were averaged within subjects to reduce errors. Surface-based statistical maps revealed powerful correlations between surface morphology and 4 variables: (1) diagnosis, (2) depression severity, (3) cognitive function at baseline, and (4) future cognitive decline over the following year. Cognitive function was assessed using the mini-mental state exam (MMSE), global and sum-of-boxes clinical dementia rating (CDR) scores, at baseline and 1-year follow-up. Lower CSF Abeta(1-42) protein levels, a biomarker of AD pathology assessed in 138 of the 240 subjects, were correlated with lateral ventricular expansion. Using false discovery rate (FDR) methods, 40 and 120 subjects, respectively, were needed to discriminate AD and MCI from normal groups. 120 subjects were required to detect correlations between ventricular enlargement and MMSE, global CDR, sum-of-boxes CDR and clinical depression scores. Ventricular expansion maps correlate with pathological and cognitive measures in AD, and may be useful in future imaging-based clinical trials.
Figures


Similar articles
-
Comparison of CSF markers and semi-quantitative amyloid PET in Alzheimer's disease diagnosis and in cognitive impairment prognosis using the ADNI-2 database.Alzheimers Res Ther. 2017 Apr 26;9(1):32. doi: 10.1186/s13195-017-0260-z. Alzheimers Res Ther. 2017. PMID: 28441967 Free PMC article.
-
Ventricular maps in 804 ADNI subjects: correlations with CSF biomarkers and clinical decline.Neurobiol Aging. 2010 Aug;31(8):1386-400. doi: 10.1016/j.neurobiolaging.2010.05.001. Neurobiol Aging. 2010. PMID: 20620663 Free PMC article.
-
CSF tau and the CSF tau/ABeta ratio for the diagnosis of Alzheimer's disease dementia and other dementias in people with mild cognitive impairment (MCI).Cochrane Database Syst Rev. 2017 Mar 22;3(3):CD010803. doi: 10.1002/14651858.CD010803.pub2. Cochrane Database Syst Rev. 2017. PMID: 28328043 Free PMC article. Review.
-
Incremental value of biomarker combinations to predict progression of mild cognitive impairment to Alzheimer's dementia.Alzheimers Res Ther. 2017 Oct 10;9(1):84. doi: 10.1186/s13195-017-0301-7. Alzheimers Res Ther. 2017. PMID: 29017593 Free PMC article.
-
Simultaneous analysis of cerebrospinal fluid biomarkers using microsphere-based xMAP multiplex technology for early detection of Alzheimer's disease.Methods. 2012 Apr;56(4):484-93. doi: 10.1016/j.ymeth.2012.03.023. Epub 2012 Apr 6. Methods. 2012. PMID: 22503777 Review.
Cited by
-
Accumulation of Cerebrospinal Fluid, Ventricular Enlargement, and Cerebral Folate Metabolic Errors Unify a Diverse Group of Neuropsychiatric Conditions Affecting Adult Neocortical Functions.Int J Mol Sci. 2024 Sep 23;25(18):10205. doi: 10.3390/ijms251810205. Int J Mol Sci. 2024. PMID: 39337690 Free PMC article.
-
A Surface-Based Federated Chow Test Model for Integrating APOE Status, Tau Deposition Measure, and Hippocampal Surface Morphometry.J Alzheimers Dis. 2023;93(3):1153-1168. doi: 10.3233/JAD-230034. J Alzheimers Dis. 2023. PMID: 37182882 Free PMC article.
-
Cerebral Folate Metabolism in Post-Mortem Alzheimer's Disease Tissues: A Small Cohort Study.Int J Mol Sci. 2022 Dec 30;24(1):660. doi: 10.3390/ijms24010660. Int J Mol Sci. 2022. PMID: 36614107 Free PMC article.
-
Sulfatide Deficiency, an Early Alzheimer's Lipidomic Signature, Causes Brain Ventricular Enlargement in the Absence of Classical Neuropathological Hallmarks.Int J Mol Sci. 2022 Dec 23;24(1):233. doi: 10.3390/ijms24010233. Int J Mol Sci. 2022. PMID: 36613677 Free PMC article.
-
Folate Related Pathway Gene Analysis Reveals a Novel Metabolic Variant Associated with Alzheimer's Disease with a Change in Metabolic Profile.Metabolites. 2022 May 24;12(6):475. doi: 10.3390/metabo12060475. Metabolites. 2022. PMID: 35736408 Free PMC article.
References
-
- Adak S, Illouz K, Gorman W, Tandon R, Zimmerman EA, Guariglia R, Moore MM, Kaye JA. Predicting the rate of cognitive decline in aging and early Alzheimer disease. Neurology. 2004;63:108–114. - PubMed
-
- Andreasen N, Minthon L, Davidsson P, Vanmechelen E, Vanderstichele H, Winblad B, Blennow K. Evaluation of CSF-tau and CSF-Abeta42 as diagnostic markers for Alzheimer disease in clinical practice. Arch Neurol. 2001;58:373–379. - PubMed
-
- Apostolova LG, Thompson PM, Green AH, Hwang K, Zoumalan C, Jack CR, Harvey D, Petersen RM, Thal L, Aisen P, Toga AW, Cummings JL, DeCarli C for the ADCS Group (submitted for publication) 3D comparison of low, intermediate, and advanced hippocampal atrophy in MCI. submitted, Sept. 2008. - PMC - PubMed
-
- Apostolova LG, Beyer MK, Green AE, Hwang KS, Morra JH, Chou YY, Avedissian C, Aarsland D, Janvin CC, Larsen JP, Cummings JL, Thompson PM. Automated 3D mapping of hippocampal and caudate atrophy and ventricular enlargement in Parkinson’s disease with and without dementia. submitted for publication. to be submitted to Neurology, Sept. 2008.
Publication types
MeSH terms
Substances
Grants and funding
LinkOut - more resources
Full Text Sources
Medical
Miscellaneous


