1895 United Kingdom general election
| |||||||||||||||||||||||||||||||||||||||||||||||||
All 670 seats in the House of Commons 336 seats needed for a majority | |||||||||||||||||||||||||||||||||||||||||||||||||
|---|---|---|---|---|---|---|---|---|---|---|---|---|---|---|---|---|---|---|---|---|---|---|---|---|---|---|---|---|---|---|---|---|---|---|---|---|---|---|---|---|---|---|---|---|---|---|---|---|---|
| Turnout | 78.4% ( | ||||||||||||||||||||||||||||||||||||||||||||||||
| |||||||||||||||||||||||||||||||||||||||||||||||||
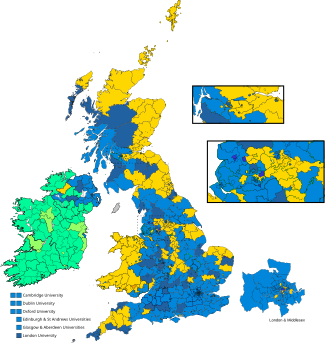
 Colours denote the winning party | |||||||||||||||||||||||||||||||||||||||||||||||||
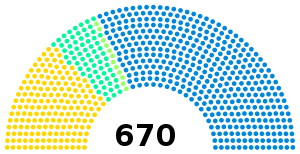
 Diagram showing the composition of the House of Commons following the election | |||||||||||||||||||||||||||||||||||||||||||||||||
| |||||||||||||||||||||||||||||||||||||||||||||||||
The 1895 United Kingdom general election was held from 13 July to 7 August 1895. The result was a Conservative parliamentary majority of 153.
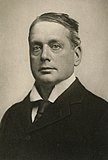
William Gladstone had retired as prime minister the previous year, and Queen Victoria, disregarding Gladstone's advice to name Lord Spencer as his successor, appointed the Earl of Rosebery as the new prime minister. Rosebery's government found itself largely in a state of paralysis due to a power struggle between him and William Harcourt, the Liberal leader in the Commons. The situation came to a head on 21 June, when Parliament voted to dismiss Secretary of State for War Henry Campbell-Bannerman; Rosebery, realising that the government would likely not survive a motion of no confidence were one to be brought, promptly resigned as prime minister. Conservative leader Lord Salisbury was subsequently re-appointed for a third spell as prime minister, and promptly called a new election.
The election was won by the Conservatives, who continued their alliance with the Liberal Unionist Party and won a large majority. The Liberals, in contrast, went down to what at the time was their worst result since the party's foundation, winning just 177 seats. The Irish Parliamentary Party was split at this time; most of its MPs (the "Anti-Parnellites") followed John Dillon, while a rump (the "Parnellites") followed John Redmond. The Independent Labour Party, having only previously existed as a loose grouping of left-wing politicians, formally organized into a party led by Keir Hardie in 1893 and contested their first election. They earned relatively little attention at this election, winning slightly less than one per cent of the popular vote and no seats, but would enjoy greater success five years later, when they ran under the banner of the Labour Representation Committee.
This was the last United Kingdom general election where neither the incumbent prime minister nor leader of the main opposition party sat in the House of Commons, with Rosebery and Salisbury both sitting in the House of Lords, and William Harcourt and Arthur Balfour respectively acting as the Commons leaders for the Liberals and Conservatives.
Results

| Candidates | Votes | ||||||||||
|---|---|---|---|---|---|---|---|---|---|---|---|
| Party | Leader | Stood | Elected | Gained | Unseated | Net | % of total | % | No. | Net % | |
| Conservative and Liberal Unionist | Lord Salisbury | 588 | 411 | 114 | 17 | +97 | 61.34 | 49.25 | 1,759,484 | +2.2 | |
| Liberal | Lord Rosebery | 447 | 177 | 18 | 112 | −94 | 26.42 | 45.58 | 1,628,405 | +0.2 | |
| Irish National Federation | John Dillon | 77 | 70 | −2 | 10.45 | 2.59 | 92,556 | −2.6 | |||
| Irish National League | John Redmond | 26 | 12 | +3 | 1.79 | 1.34 | 47,698 | −0.2 | |||
| Ind. Labour Party | Keir Hardie | 28 | 0 | 0 | 0 | 0.96 | 34,433 | N/A | |||
| Independent Liberal | N/A | 3 | 0 | −1 | 0 | 0.10 | 3,733 | ||||
| Social Democratic Federation | H. M. Hyndman | 4 | 0 | 0 | 0 | 0.09 | 3,122 | +0.1 | |||
| Independent Lib-Lab | N/A | 2 | 0 | 0 | 0 | 0.07 | 2,348 | ||||
| Independent Labour | N/A | 1 | 0 | −3 | 0 | 0.02 | 608 | ||||
| Independent | N/A | 2 | 0 | 0 | 0 | 0 | 0 | 0.00 | 52 | ||
Voting summary
Seats summary
See also
- List of MPs elected in the 1895 United Kingdom general election
- Parliamentary franchise in the United Kingdom 1885–1918
- 1895 United Kingdom general election in Ireland
Notes
- ^ All parties shown.
- ^ "General Election Results 1885-1979". Archived from the original on 30 January 2012. Retrieved 21 June 2022.
References
- Craig, F. W. S. (1989), British Electoral Facts: 1832–1987, Dartmouth: Gower, ISBN 0900178302
- Craig, F. W. S. (1974), British Parliamentary Election Results 1885–1918, Macmillan
- Readman, Paul A. (1999), "The 1895 general election and political change in late Victorian Britain", Historical Journal, 42 (2): 467–493, doi:10.1017/S0018246X98008322, JSTOR 3020996, S2CID 154822555
- Roberts, Andrew (1999), Salisbury: Victorian Titan, pp. 596–604[publisher missing]
External links
- Articles with short description
- Short description is different from Wikidata
- Use dmy dates from May 2014
- Use British English from May 2014
- Pages using bar box without float left or float right
- Webarchive template wayback links
- 1895 United Kingdom general election
- 1895 elections in the United Kingdom
- General elections to the Parliament of the United Kingdom
- 1895 in the United Kingdom
- July 1895 events
- August 1895 events
- 1895 elections in Ireland
- Robert Gascoyne-Cecil, 3rd Marquess of Salisbury
- Archibald Primrose, 5th Earl of Rosebery


