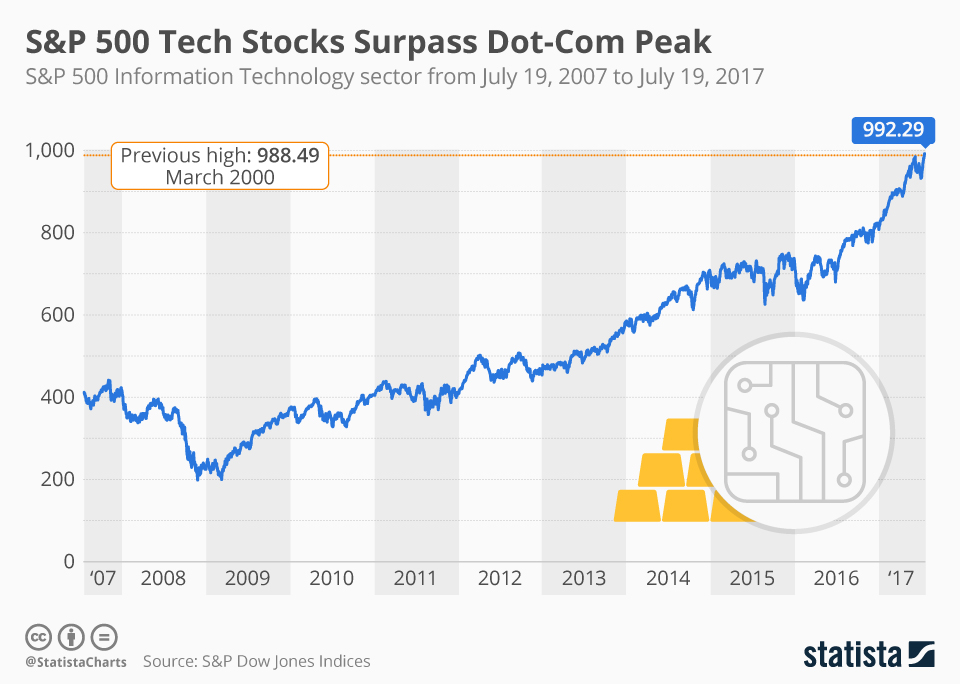
Tech stocks have finally clawed their way back to the glorious heights of the dot-com boom. At close of trading yesterday, the S&P 500 Information Technology sector had reached 992.29, bettering the 988.49 record set in March 2000. The recent surge which has helped the index over this symbolic milestone has been fueled in part by better than expected profits across a wide range of companies.
With high-profile players like Netflix enjoying a great period, investor optimism is high. As another example, Facebook stocks are around 40 percent higher today than when compared to the end of last year. The real test though will be in sustaining and improving on the position. Only time will tell if this optimism has been well-placed.
Related Infographics
FAQ
- The Statista "Chart of the Day", made available under the Creative Commons License CC BY-ND 3.0, may be used and displayed without charge by all commercial and non-commercial websites. Use is, however, only permitted with proper attribution to Statista. When publishing one of these graphics, please include a backlink to the respective infographic URL. More Information
- The Statista "Chart of the Day" currently focuses on two sectors: "Media and Technology", updated daily and featuring the latest statistics from the media, internet, telecommunications and consumer electronics industries; and "Economy and Society", which current data from the United States and around the world relating to economic and political issues as well as sports and entertainment.
- For individual content and infographics in your Corporate Design, please visit our agency website www.statista.design
Any more questions?
Get in touch with us quickly and easily.
We are happy to help!
Do you still have questions?
Feel free to contact us anytime using our contact form or visit our FAQ page.
Your contact to the Infographics Newsroom
Statista Content & Design
Need infographics, animated videos, presentations, data research or social media charts?